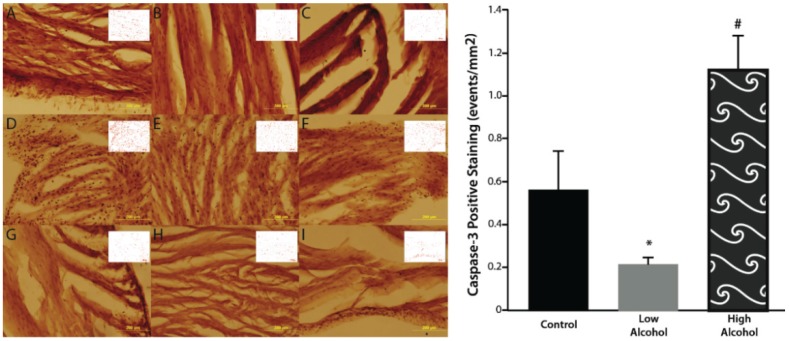
Figure 2.
There is significantly elevated caspase positive events in the high alcohol group (D–F) compared to controls (A–C) and low alcohol animals (G–I) in the epicardial (A, D, G), myocardial (B, E, H), and endocardial (C, F, I) layers. Low alcohol (G–I) displayed significantly lower caspase positive events compared to both high alcohol (D–F) and controls (A–C). ImageJ-generated profiles are inset on each image. Magnification of 20× are displayed above; scale bar = 200 μm. * p < 0.05 compared to control and HA; # p < 0.05 compared to control and LA.

