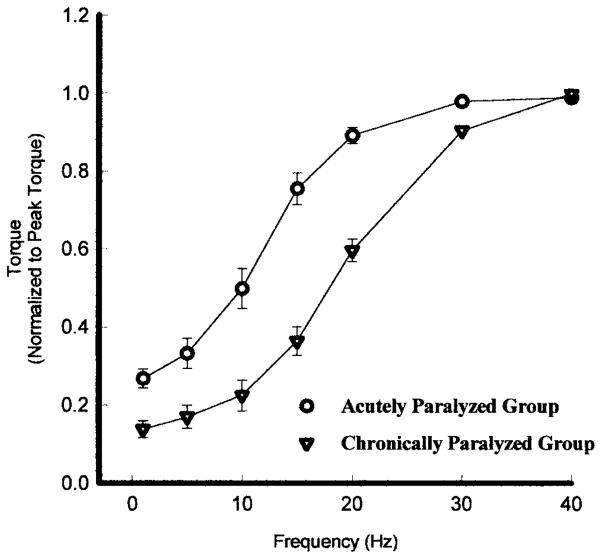
FIGURE 7.
The average torque–frequency curve, normalized for each subjects maximal torque, for an acutely paralyzed group (○) and a chronically paralyzed group (▽). Because of the faster contractile speeds the chronically paralyzed group curve is shifted to the fight. Error bars are standard deviations.

