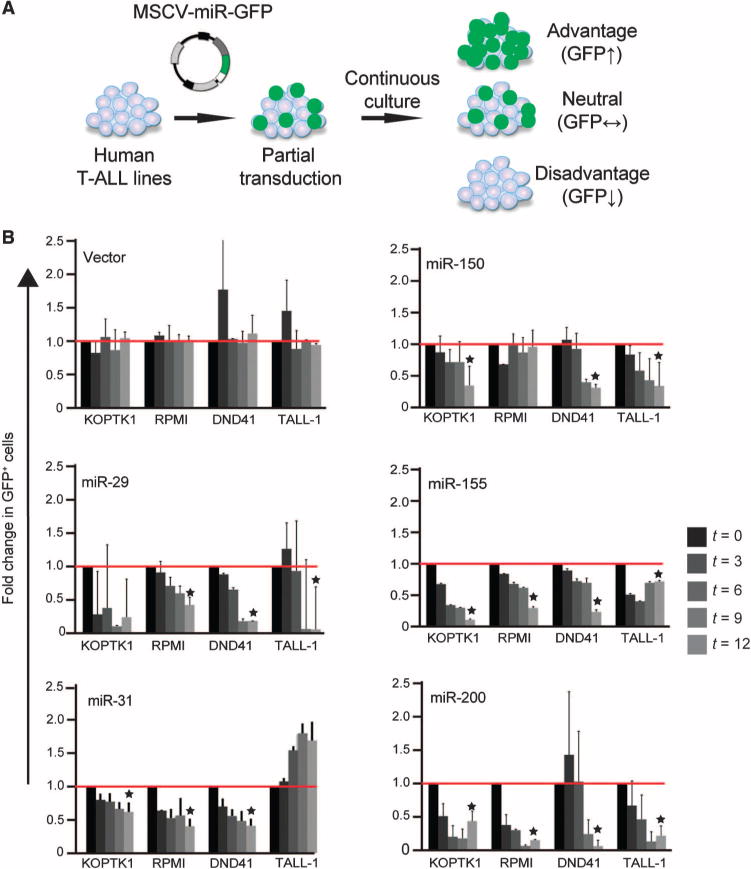
Fig. 2. Analysis of miRNAs with antileukemic potential.

(A) Schematic of the competition assay in which human T-ALL cell lines were transduced with retroviruses expressing individual miRNAs and GFP, and the proportion of miRNA-expressing cells (as determined by GFP fluorescence) within each population was monitored by flow cytometric analysis. Those miRNAs that provided a proliferative advantage to the transduced cells resulted in an increased proportion of GFP+ cells. (B) A panel of the indicated human T-ALL cell lines were transduced with retrovirus expressing the indicated miRNAs and GFP, and the proportions of each cell population that expressed each miRNA (defined as GFP+ cells) at the indicated times (t, in days) were determined by flow cytometric analysis. The proportions of GFP+ cells at each time point are expressed relative to those on day 3 after infection. Data are means ± SD of three independent experiments. Only those miRNAs that showed a statistically significant effect on proliferation (*P < 0.05 by Student’s t test) in at least three of the four cell lines tested were selected for subsequent experiments.
