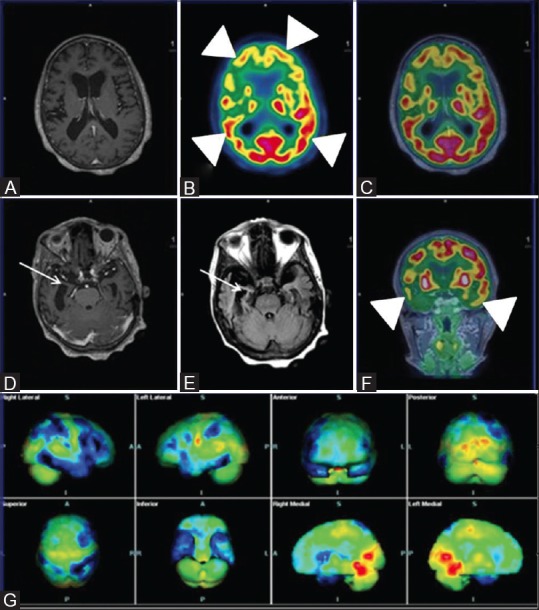
Figure 2 (A-G).

Axial T1wMPRAGE (A) Reveals cerebral atrophy and significant bilateral fronto-parietal and temporal hypometabolism (white arrowheads) on axial PET (B) Axial fused PET/MRI (C) and coronal PET (F) Consistent with established AD; Note asymmetrical glucose metabolism of right fronto-parieto-temporal region; Axial T1wMPRAGE (D) and FLAIR images (E) Reveal loss of hippocampal volume and sclerosis (white arrows) affecting the right side more than the left. Statistical parametric map surface display (G) Shows marked asymmetrical bilateral cerebral hemisphere hypometabolism (blue) (R > L)
