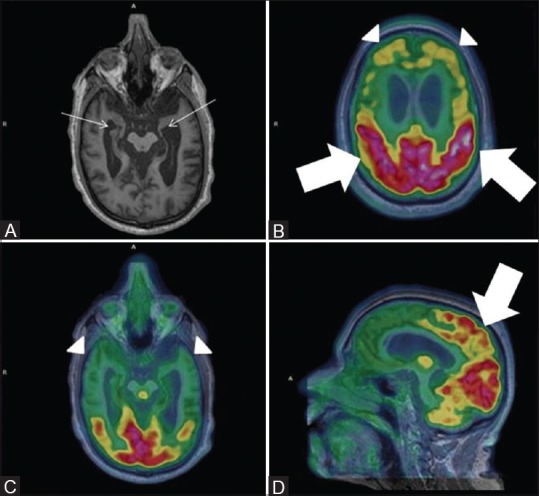
Figure 4 (A-D).

Severe bilateral hippocampal atrophy evident by severely reduced hippocampal volume (white arrows) (Left more than right) on Axial MRI images (A) With prominent bilateral frontal and temporal hypometabolism on axial fused PET MRI images (white arrowhead) (B and C). Note preserved parietal metabolism on axial and sagittal fused PET MRI images (white thick arrows) (D)
