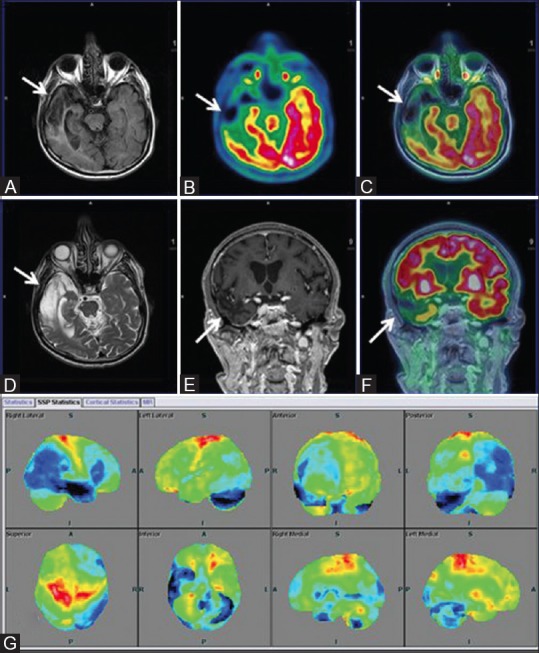
Figure 7 (A-G).

(A) Asymmetrical focal areas of hypometabolism in right temporal region (white arrow) on axial PET and T2w MRI images (B) Axial fused PET-MRI (C) Coronal T1w MPRAGE (D) Suggesting old infarcts consistent with VaD. Surface display of statistical parametric map (E) and coronal fused PET/MRI (F) with corresponding areas of encephalomalacia and gliosis (white arrow) on axial FLAIR (G) Showing marked hypometabolism (blue) in right temporal and left temporo occipital regions, compared to standard database of Scenium software
