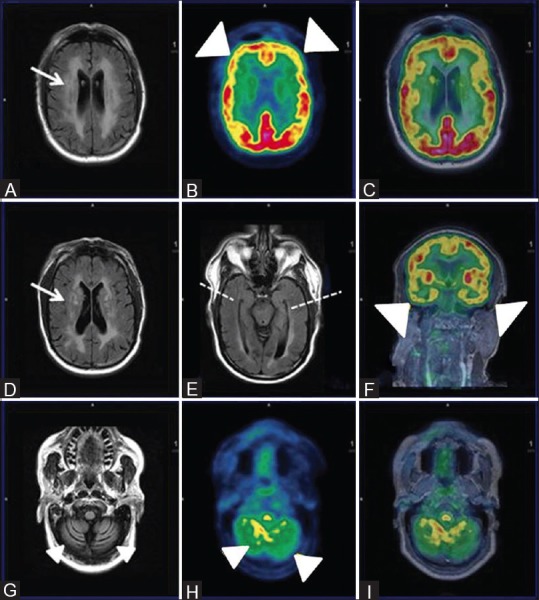
Figure 8 (A-I).

Axial FLAIR Images (A and D) Reveal extensive non-enhancing white matter hyperintensities in bilateral periventricular and deep white matter (white arrows) with cerebral and cerebellar atrophy (white arrowhead) (G) Axial PET (B and H), fused PET/MRI (C and I) and coronal fused PET MRI reveal reduced FDG uptake inbilateral frontal, temporal (R > L) and cerebellum (white arrowheads) with relatively spared bilateral parieto-occipital lobes. Axial FLAIR image showing symmetrical bilateral temporal lobes and hippocampi with apparent normal volume and signal intensity (broken white line)
