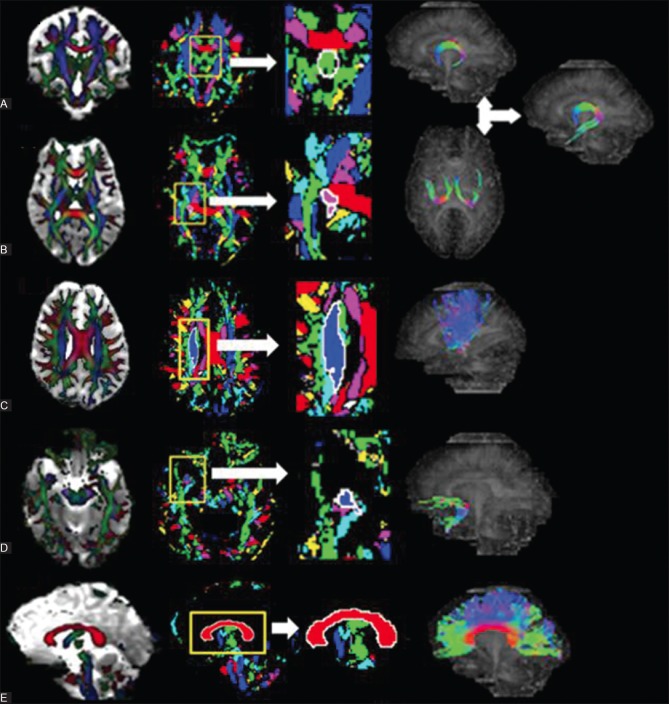
Figure 1 (A and B).
A schematic presentation of the fiber tract reconstruction for the fornix (C) superior thalamic radiation (D) uncinate fasciculus and (E) corpus callosum, in the study participants. Column (i) shows the FA map overlaid on the MD map. For each tract, the section perpendicular to the tract was taken. Column (ii) shows the stable fiber mass map, which contains the signature segments of each tract. Column (iii) is an enlarged view of the signature segment. By clicking into it, the boundary of the ROI used for fiber generation is automatically drawn (seen as white line). Column (iv) shows the respective tract generated by the FACT algorithm (Fornix is constructed by placing three ROIs, one on the coronal section (A-i) and two bilateral ROIs on the axial (B-i) sections, and finally adding the fibers using the OR function)

