
Fig. 6.
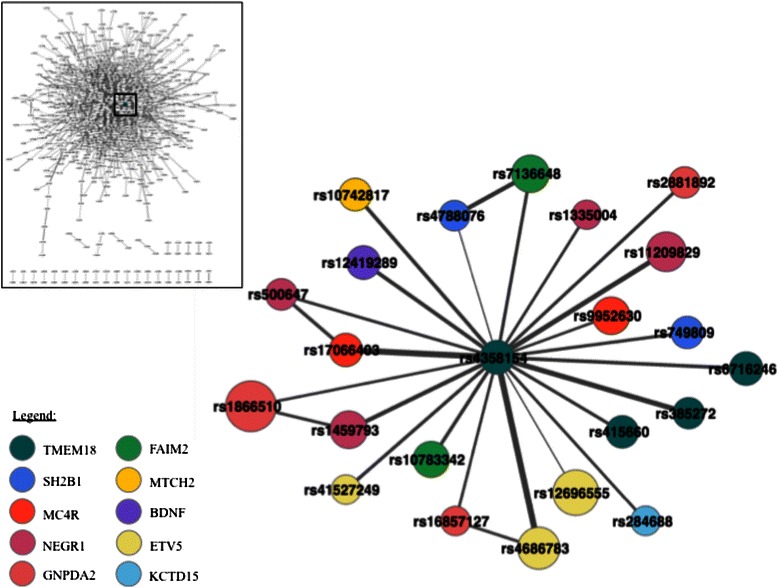
Focused view on the node (rs4358154 in TMEM18) showing the highest degree, betweenness centrality and closeness centrality within the Statistical Epistasis Network. Shown are all the direct neighboring nodes of rs4358154. Nodes are color coded based on their gene category. Node size represents the strength of the main effect of a SNP. The thickness of an edge represents the strength of the interaction between two SNPs