Figure 2.

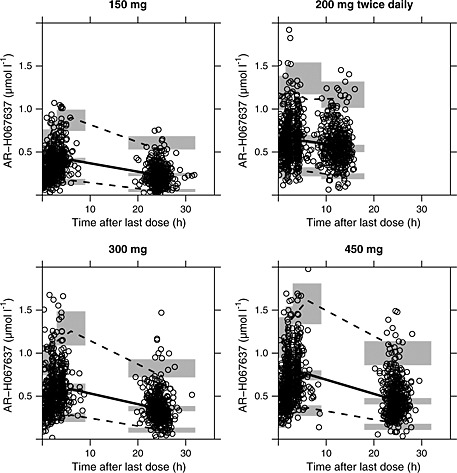
AR‐H067637 plasma concentrations over time after last dose (circles) including model predicted means (solid line) and 5th and 95th percentiles (dashed lines). The shaded grey areas show the 95% CI limits for the mean and percentiles

AR‐H067637 plasma concentrations over time after last dose (circles) including model predicted means (solid line) and 5th and 95th percentiles (dashed lines). The shaded grey areas show the 95% CI limits for the mean and percentiles