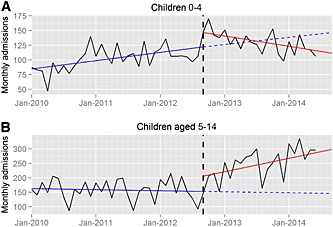
Figure 2.

Time series plots for hospital admissions with paracetamol poisoning in England for children between January 2010 and July 2014. Data are shown for (A) children aged 0–4 and (B) children aged 5–14 years old. The vertical dashed black line denotes the date of the Medicines and Healthcare Products Regulatory Agency guideline change, September 2012. The solid blue line shows the trend before the guideline change, the solid red line the trend after the change and the blue dashed line the predicted trend if the guideline change had not occurred
