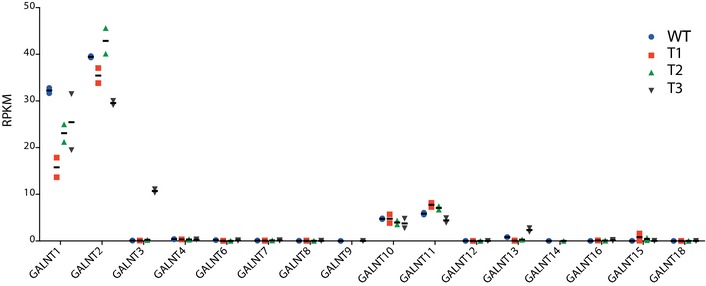
Figure 4. RNAseq transcriptome analysis of isogenic HepG2 cells.

Transcript levels in RPKM (reads per kilobase transcriptome per million mapped reads) of GalNAc‐Ts in two individual clones of isogenic HepG2 lines as indicated. Apart from minor changes in the GALNT1 and GALNT2 transcript levels, all transcript levels were similar. Bars represent mean values, and error bars represent SD.
