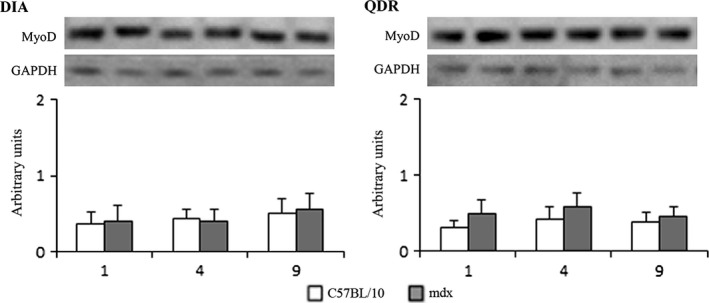
Figure 5.

Western blot analysis of MyoD in crude extracts of diaphragm (DIA) and quadriceps (QDR) from C57BL/10 and mdx mice at 1, 4 and 9 months of age. Bands indicate Western blot of MyoD and the same blot reprobed for GAPDH as a loading control. Graphs represent the level of each indicated protein expressed in arbitrary units normalized to GAPDH levels. There were no differences in MyoD levels between control and dystrophic muscles, at the ages studied.
