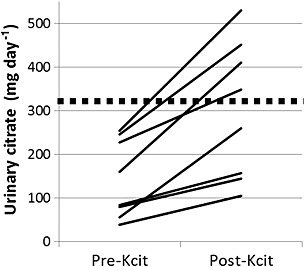
Figure 2.

Urinary citrate excretion from the 24 h urine collections of eight patients in study 2 (effects of potassium citrate on topiramate‐induced hypocitraturia) who were on topiramate for 19 ± 16 months (range 0.90–49 months) and then added potassium citrate. Data for ‘pre‐Kcit’ represent urine citrate while on topiramate only. Data for ‘post‐Kcit’ represent urine citrate while on both topiramate and potassium citrate for 9.7 ± 4.1 months (range 4.5–17 months). The dashed line shows the risk cutoff for hypocitraturia (320 mg day–1). Increase in urinary citrate after potassium citrate was significant (paired t‐test, P = 0.0013)
