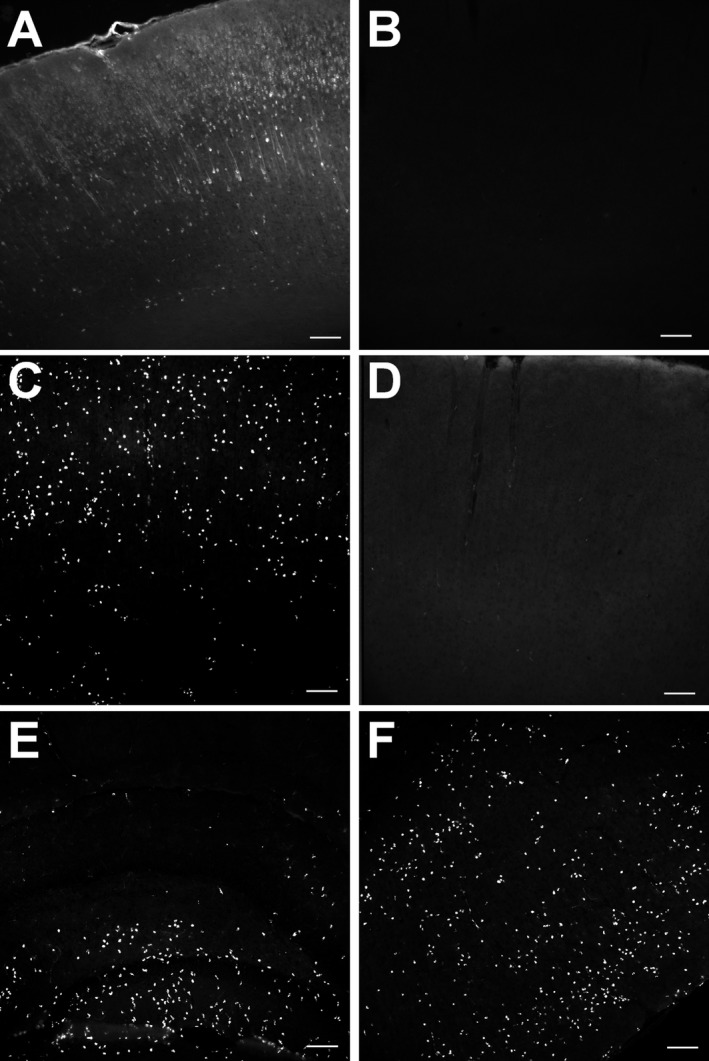
Figure 4.

Reduction in blood–brain barrier breakdown and of macrophages in animals treated with deep hypothermia. (A and B) These images show IgG‐like immunoreactivity in the frontoparietal cortex 48 h following status epilepticus in a normothermic (A) and hypothermic (B) animal. Bars = 100 microns. (C–F) These images show staining with a macrophage marker in frontoparietal cortex (C and D), hippocampus (E) and piriform cortex (F) of normothermic (C, E, and F) and hypothermic animals (D). Bars = 100 microns.
