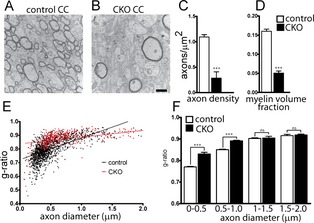
Figure 3.

Decreased myelin density and myelin thickness in Tsc2‐Olig2 CKO. Electron micrographs from P60 littermate control (A) and Tsc2‐Olig2 CKO (B) CC demonstrate a decreased density of myelinated axons in CKO (C) brains as well as a reduction in the myelin volume fraction (D). Scale bar = 500 nm. Myelin thickness is decreased as demonstrated by an increased G ratio in Tsc2‐Olig2 CKO CC (E). G ratio plotted as a function of axon diameter bins (F). n > 50 axons from three animals per genotype. ***P < 0.001 by Student's t‐test. CKO, conditional knockout; CC, corpus callosum.
