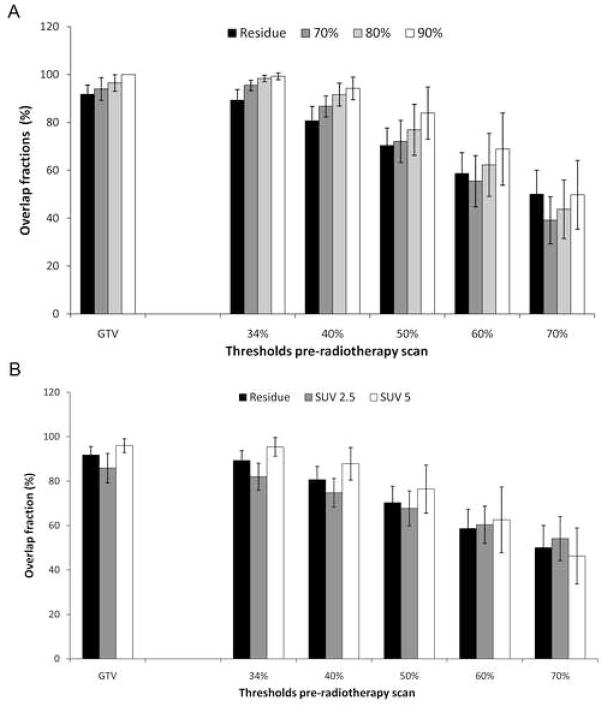
Figure 5.
Overlap-fractions (OF) of the pre-radiotherapy with the post-radiotherapy relative (A) and absolute (B) SUVmax thresholds are shown. OF s of the post-radiotherapy residual-areas are indicated with the black-bars. The other bars indicate the OF with the high FDG-uptake areas within the residue (A) and absolute thresholds (B). The data are expressed as mean ± 95% confidence-intervals.

