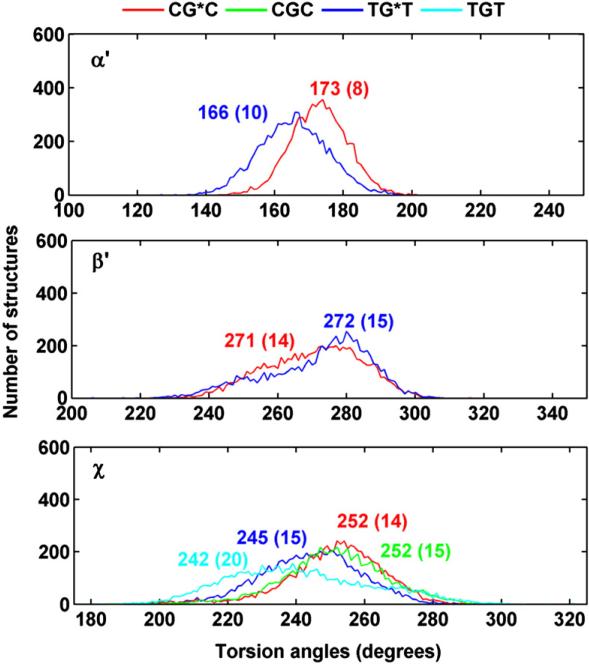
Fig. 4.
Population distribution of the carcinogen–DNA linkage site and glycosidic torsion angles α′, β′ and χ. CG*C is red and TG*T is blue; CGC is green and TGT is cyan. Ensemble averages and standard deviations (in parentheses) are given. Time dependence of these torsion angles are given in Fig. S1, Supplementary Data.

