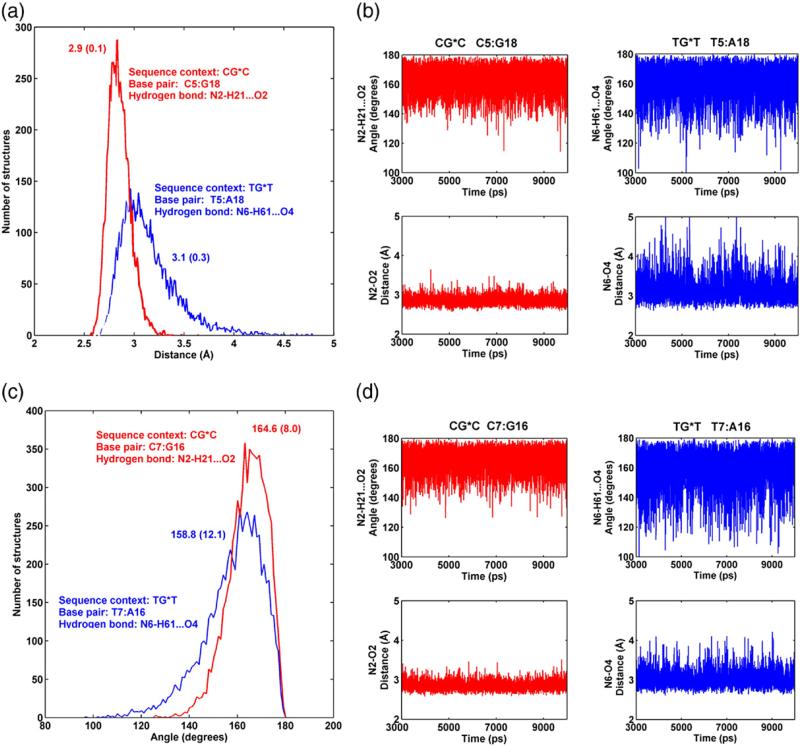
Fig. 6.
(a) Population distribution and (b) time dependence of hydrogen bond distances and angles for base pair 5:18; (c) population distribution and (d) time dependence of hydrogen bond distances and angles for base pair 7:16. CG*C is red and TG*T is blue. Ensemble averages and standard deviations (in parentheses) are given for (a) and (c). Only the hydrogen bond on the major groove side for either step is shown. Full analyses of hydrogen bonds at the lesion site for CG*C and TG*T and their unmodified sequence contexts are shown in Fig. S3, Supplementary Data.

