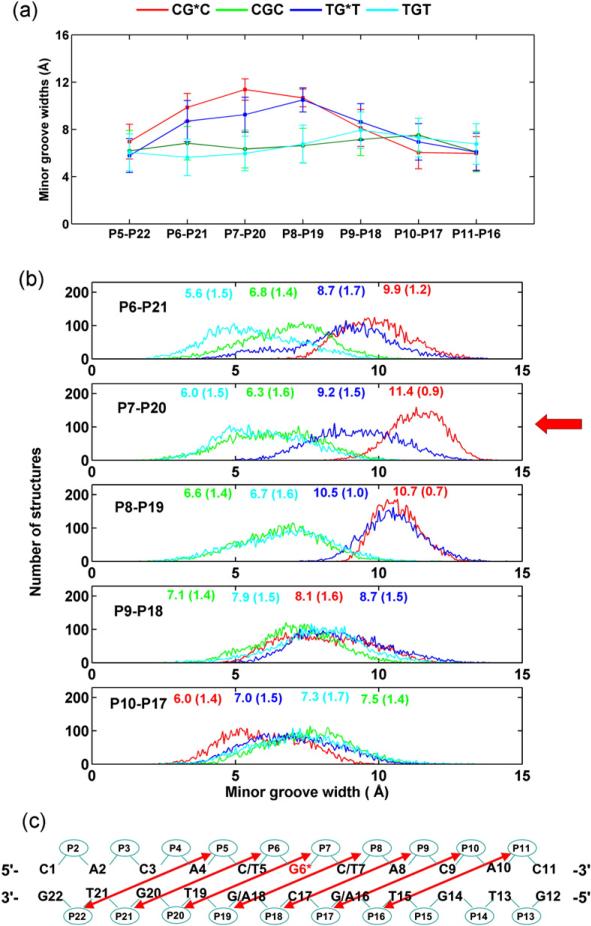
Fig. 8.
(a) Trajectory average MG widths of the modified duplexes and unmodified controls. (b) Population distribution of the MG width near/at the lesion site for CG*C, CGC, TG*T, and TGT. Ensemble averages and standard deviations (in parentheses) are given. (c) MG widths are the distance between P5 and P22, P6 and P21, P7 and P20, and so on, less 5.8 Å to account for the van der Waals radius of the phosphorus atoms.67 The most significant difference is indicated with a red arrow.

