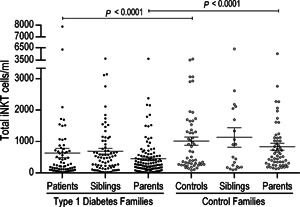
Figure 1.

Total iNKT cell deficiency in families with type 1 diabetes. Absolute total iNKT cell numbers in type 1 diabetes families (black circles) and control families (white circles). Only significant differences between comparable groups are shown. The Mann–Whitney U‐test was utilized. The mean and SE values are indicated with a horizontal line.
