Figure 2.

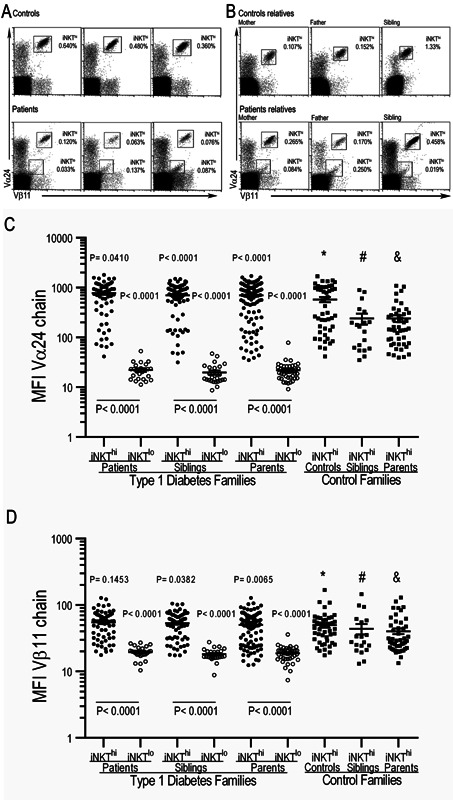
iNKT cells have low iTCR expression in type 1 diabetes patients and their first‐degree relatives. Representative dot plots from three different healthy controls and T1D patients (A) or their first‐degree relatives (B) show the iTCR expression (Va24+Vβ11+) on CD3+ cells. (C) Mean fluorescence intensity of the V α24 and V β11 (D) chains of the iTCR from iNKT cell populations from T1D and control families. The Mann–Whitney U‐test was utilized. The mean and SE values are indicated with a horizontal line. *Control versus patients; #control siblings versus patient siblings; & parents of controls versus parents of patients.
