Figure 3.

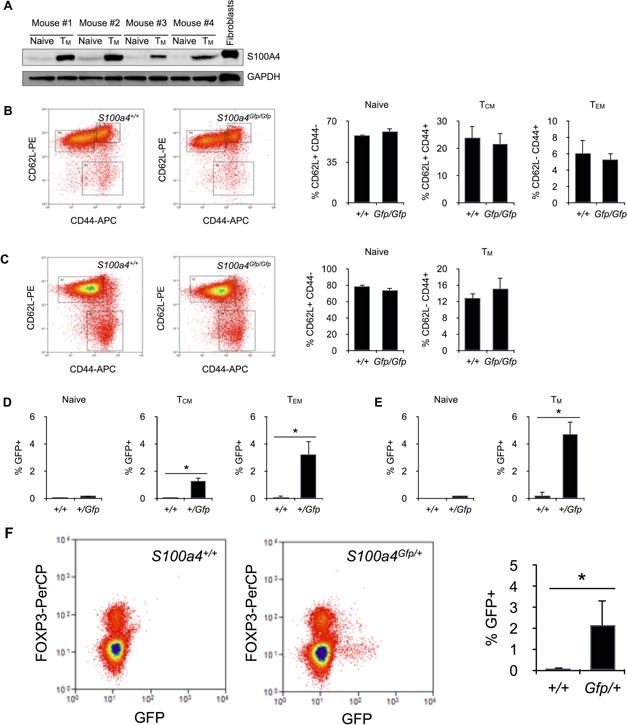
Memory T cells express S100A4. A: Western blot analysis of S100A4 expression in purified naive or memory CD4+ T cells. Positive control for S100A4 expression included lysate from NIH‐3T3 fibroblasts. B: Subsets of central (TCM) and effector (TEM) memory CD8+ T cells were identified in the spleen of S100a4Gfp/Gfp or S100a4+/+ mice by flow cytometry. Relative numbers of CD44low CD62Lhigh naive T cells, CD44high CD62Lhigh TCM and CD44high CD62Llow TEM within CD3+ CD8+ T cells isolated from S100a4Gfp/Gfp or S100a4+/+ mice. Mean ± SD. n = 5 mice per group. C: Subsets of memory CD4+ T cells were identified in the spleen of S100a4Gfp/Gfp or S100a4+/+ mice. Relative numbers of CD44low CD62Lhigh naive T cells and CD44high CD62Llow memory T cells within CD3+ CD4+ T cells isolated from S100a4Gfp/Gfp or S100a4+/+ mice. Mean ± SD. n = 5 mice per group. D: S100A4 expression in naive, central (TCM) and effector (TEM) memory CD8+ T cells. Relative numbers of S100A4‐expressing cells (% GFP+ cells) within CD44low CD62Lhigh naive, CD44high CD62Lhigh TCM, or CD44high CD62Llow TEM CD3+ CD8+ T cells were determine by flow cytometry. Mean ± S n = 5 mice per group. *P < 0.05. E: S100A4 expression in naive and memory CD4+ T cells. Relative numbers of S100A4‐expressing cells (% GFP+ cells) within CD44low CD62Lhigh naive or CD44high CD62Llow TEM CD3+ CD4+ T cells were determine by flow cytometry. Mean ± SD. n = 5 mice per group. *P < 0.05.
