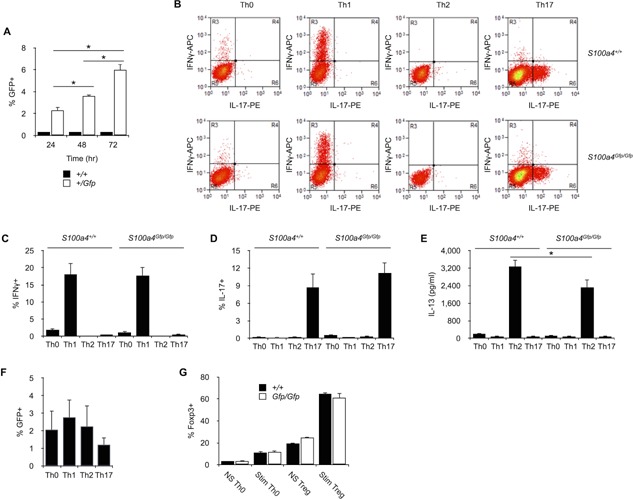
Figure 4.

Thelper differentiation in S100A4‐deficient mice. A: S100A4 expression after T cell activation. Splenic CD4+ T cells were purified from S100a4+/Gfp or S100a4+/+ and stimulated with immobilized anti‐CD3 and soluble anti‐CD28 antibodies. After 24, 48, or 72 h of culture, relative numbers of S100A4‐expressing cells (% GFP+ cells) were determine by flow cytometry. Mean ± SD. n = 5 culture replicates. *P< 0.05. Data are representative of two independent experiments. B: Th0, Th1, Th2, or Th17 differentiation in S100a4Gfp/Gfp or S100a4+/+ CD4+ T cells. Splenic CD4+ T cells were purified from S100a4Gfp/Gfp or S100a4+/+ mice and stimulated with immobilized anti‐CD3 and soluble anti‐CD28 antibodies in Th0‐, Th1‐, Th2‐, or Th17‐conditioning medium. IFNγ+ or IL‐17+ cells within CD3+ CD4+ cells were identified by flow cytometry. C: Relative numbers of IFNγ+ cells within S100a4+/Gfp or S100a4+/+ Th0, Th1, Th2, or Th17 cells. Mean ± SD. n = 5 culture replicates. *P < 0.05. Data are representative of two independent experiments. D: Relative numbers of IL‐17+ cells within S100a4+/Gfp or S100a4+/+ Th0, Th1, Th2, or Th17 cells. Mean ± S n = 5 culture replicates. Data are representative of two independent experiments. E: Amount of IL‐13 present in the supernatants of Th0, Th1, Th2, or Th17 cell cultures was assessed by ELISA. Mean ± SD. n = 5 culture replicates. *P < 0.05. Data are representative of two independent experiments. F: S100A4 expression in Th0‐, Th1‐, Th2‐, or Th17‐derived CD4+ effector T cells was analyzed by flow cytometry. Mean ± SD. n = 5 culture replicates. Data are representative of two independent experiments. G: FOXP3+ Treg cell differentiation in S100a4Gfp/Gfp or S100a4+/+ CD25− CD62L+ CD4+ naive T cells. Splenic T cells were purified from S100a4Gfp/Gfp or S100a4+/+ mice and stimulated (Stim) or not (NS) with immobilized anti‐CD3 and soluble anti‐CD28 antibodies in Th0‐ or Treg‐conditioning media. Relative numbers of FOXP3+ T cells within CD3+ CD4+ cells were identified by flow cytometry. Mean ± SD. n = 6 culture replicates. Data are representative of two independent experiments.
