
Figure 1.
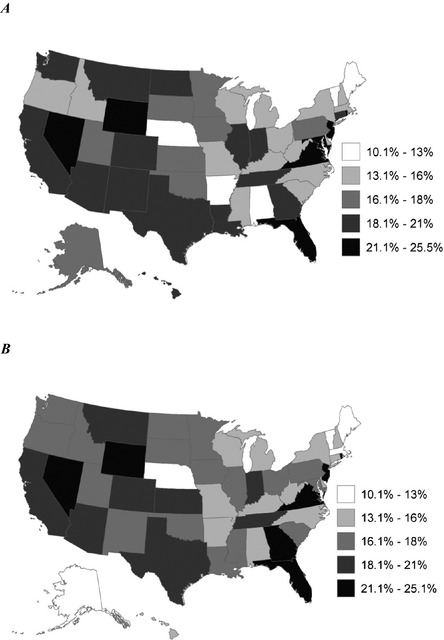
Unadjusted and Adjusted False‐Negative Rates for Children. (A) Unadjusted Rate for Children Age 0–18. (B) Adjusted Rate for Children Age 0–18 Source: Reweighted estimates from the 2009 American Community Survey linked to MSIS, civilian noninstitutional population. The regression adjusted rates are based on a logistic regression model and are calculated using average marginal effects. They control for race, gender, poverty status, citizenship, household education, and household employment. Tables of values and regression coefficients are included in the appendix.