

Abstract
Objective
To assess a quality improvement disparity reduction intervention and its sustainability.
Data Sources/Study Setting
Electronic health records and Quality Index database of Clalit Health Services in Israel (2008–2012).
Study Design
Interrupted time‐series with pre‐, during, and postintervention disparities measurement between 55 target clinics (serving approximately 400,000 mostly low socioeconomic, minority populations) and all other (126) clinics.
Data Collection/Extraction Methods
Data on a Quality Indicator Disparity Scale (QUIDS‐7) of 7 indicators, and on a 61‐indicator scale (QUIDS‐61).
Principal Findings
The gap between intervention and nonintervention clinics for QUIDS‐7 decreased by 66.7 percent and by 70.4 percent for QUIDS‐61. Disparity reduction continued (18.2 percent) during the follow‐up period.
Conclusions
Quality improvement can achieve significant reduction in disparities in a wide range of clinical domains, which can be sustained over time.
Keywords: Health disparities, intervention, quality improvement
Eliminating disparities in health and health care has been a long‐standing goal of health care systems worldwide (Marmot et al. 2010). A promising approach that has been suggested for reducing health disparities by health care organizations is quality improvement (QI) (Fiscella et al. 2000; Lurie, Jung, and Lavizzo‐Mourey 2005; Chin and Chien 2006). Chin et al. (2012) have outlined a five‐step roadmap for reducing racial and ethnic disparities in health care by incorporating targeted interventions into QI efforts—from recognition of disparities, to implementation, evaluation, and finally, achievement of sustainability. Yet implementing effective interventions to reduce disparities is challenging (Haws et al. 2007; Peek, Cargill, and Huang 2007; Chin 2010; Cooper et al. 2013). Consequently, most interventions have been limited to specific settings or health conditions (Miranda et al. 2003; Sequist et al. 2010; McPheeters et al. 2012), thereby reducing their real‐world application (Koh et al. 2010). Also, although many have noted its significance, assessment of sustainability has been largely limited to studies focused on one or two health conditions (Ziemer et al. 2006; Chin et al. 2007); it has yet to be demonstrated if interventions can sustain positive results for a broad array of health conditions.
The aim of this study was to evaluate the ability of a 3‐year organization‐wide, locally tailored disparity reduction strategy implemented within a QI framework to reduce health disparities while improving the quality of care among disadvantaged populations. We further examine whether results of the intervention were sustainable after the focused top‐down activities were halted, and if there were spillover effects that impacted measures beyond the focus areas. In a previous paper, we reported on the development and initial implementation of the QI disparity reduction strategy undertaken by a large health care organization in Israel covering and providing care for over half of the population (Balicer et al. 2011). We hereby present the findings of the 3‐year intervention, as well as the results from a 1‐year follow‐up measuring sustainability.
Methods
Setting
Clalit Health Services (Clalit), Israel's largest not‐for‐profit health fund (insurer and provider), serves over 4 million people in a context where health insurance is universal and mandatory. The health fund system in Israel is primary care‐based, which emphasizes community‐delivered care and preventive care (OECD 2012).
Study Design and Data Collection
This was an interrupted time‐series study assessing and comparing a composite quality score measured at 55 target primary care Clalit clinics and 126 other medium‐large clinics, serving at least 1,500 members each. The score was calculated for the preintervention phase (December 2007–December 2008), the active intervention phase (December 2008–December 2011), and after its completion (December 2011–December 2012). Data were compiled from the organization's Quality Index database, derived from demography, laboratory, medication, and primary care clinical and administrative data sources in Clalit's central data warehouse of electronic health records. The Institutional Review Board of Clalit Health Services approved this research, approval #K‐172/2011.
Population
The 55 targeted primary care clinics that serve about 10 percent of Clalit's total enrolled population nation‐wide are predominantly classified as clinics serving low socioeconomic and minority populations according to area‐level categorizations of Israel's Central Bureau of Statistics (2008). These clinics had at baseline (2008) low scores on seven quality process and outcome measures (detailed below), which were selected as they represented clinical areas in which there were identified disparities between low socioeconomic status (SES) and minority patients and the overall Clalit population (detailed in our previous report: Balicer et al. 2011).
Intervention
Clalit's strategy followed Chin's five‐step roadmap (Chin et al. 2012), involving top‐down and bottom‐up complementary components. The top‐down approach sought to enhance general care management skills, effective teamwork, proactive patient engagement, and health information technology support tools among medical professionals and other clinic staff. This was implemented through quality target setting and monitoring and direct involvement of the chief executive officer. The bottom‐up approach incorporated clinic‐specific policy changes, intraorganizational professional training in teamwork and specific clinical areas, and culturally tailored interventions according to the specific needs of the local population. Details of specific types of interventions are provided in Appendix SA2. Both components were implemented during the intervention period (December 2008–December 2011), with the structured top‐down effort (monitoring and feedback) ending in December 2011.
Outcomes
A composite weighted score incorporating seven quality indicators, called the Quality Indicator Disparity Scale (QUIDS‐7), was developed for assessing clinics' average quality indicator attainment. Details on the QUIDS‐7 weighting scheme are provided in our earlier publication (Balicer et al. 2011). In short, the QUIDS‐7 includes the following indicators: (1) diabetes control, measured as HbA1c <9 percent mg/dl; (2) blood pressure control, defined as ≤160/100 mmHg; (3) lipid control, with LDL <100 mg/dl; (4) the percentage of infants age 9–18 months with hemoglobin levels above 105 g/l; and the performance of (5) a mammography test once every 2 years in women age 50–74 years; (6) a FOBT once every year in all adults age 50–74 years who did not perform a colonoscopy; and (7) an influenza vaccination once every year for members age 65 years or older, or who were chronically ill, defined as having at least one of 34 chronic diagnoses listed in the Clalit chronic disease registry.
To determine whether there was a farther‐reaching effect on quality outside of these seven domains, a 61‐indicator composite quality score (QUIDS‐61) was also examined. These 61 indicators are routinely measured throughout all clinics as part of continuous organization‐wide QI (not specifically focused on disparity reduction) and are updated annually according to changes in guidelines. As the organizational guidelines for LDL targets were changed midway through the intervention to maintain consistency, the QUIDS scores were evaluated based on the lipid control quality criteria in place at baseline (LDL <100 mg/dl).
Analysis
The seven indicators were examined individually by calculating the percentages of people who met the guideline criteria for each indicator among the relevant at‐risk population. The change in these proportions over the preintervention period, active intervention period, and postintervention period was also assessed. To determine the average annual improvement during each of the active intervention years, we calculated the cubic‐root annual change. Differences between the QUIDS scores were compared for the three time periods, and the percent change in these differences over time was calculated to assess the degree to which baseline (2008) gaps were minimized.
Linear regression was employed to model the disparity in the QUIDS‐7 score for the period, using year and phase and phase‐year interaction as predictors. With this analysis, a significant phase‐year interaction would demonstrate that the program has a significant effect. The linear regression analysis was also performed for the QUIDS‐61 score.
Results
There were 397,188 members in the target clinics and 2,188,950 in the nonintervention clinics at baseline (December 2008). Target clinics were those serving predominantly low SES and minority populations (82 and 74 percent of target clinics compared to 48 and 33 percent, respectively, in all other clinics) (Balicer et al. 2011). Population characteristics differed between the intervention and nonintervention clinics, yet, as the composite quality measure was determined according to specific indicators, attainment was always calculated as a percent of the target population for each indicator (as detailed above).
In the intervention clinics, the QUIDS‐7 demonstrated a 10.7 percent increase over the course of the active intervention (Table 1a), while in the nonintervention clinics, the QUIDS‐7 score increased by 2.7 percent during the same period (Table 1b). The change in QUIDS‐7 was 2.5, 3.7, and 1.6 percent in intervention clinics and 1.8, 0.9, and 0.9 percent in nonintervention clinics at the preintervention, 3‐year annual average active intervention, and postintervention phases, respectively.
Table 1.
Quality Indicator Proportions and QUID‐7 Score for Intervention Clinics and Nonintervention Clinics, Preintervention, during Active Intervention and Postintervention Periods
| Preintervention | Active Intervention | Postintervention | ||||||||
|---|---|---|---|---|---|---|---|---|---|---|
| Dec. 2007 (Cases That Meet the Criteria/Total Relevant N) | Dec. 2008 (Cases That Meet the Criteria/Total Relevant N) Baseline | Total % Change Mar. 2008–Dec. 2008 | Dec. 2009 | Dec. 2010 | Dec. 2011 | Total % Change from Baseline Dec. 2008–Dec. 2011 | Annual Change Dec. 2008–Dec. 2011 | Dec. 2012 Follow‐Up Year | Total % Change Dec. 2011‐Dec. 2012 | |
| Intervention clinics | ||||||||||
| QUIDS‐7 | 55.4 | 56.8 | 2.5 | 60.6 | 62.4 | 62.9 | 10.7 | 3.7 | 63.9 | 1.6 |
| Blood pressure control: % of all known hypertensive patients with blood pressure at or below 160/100 mmHg | 88.5 | 90.3 | 1.8 | 93.4 | 95.0 | 95.2 | 4.8 | 1.6 | 95.4 | 0.2 |
| Anemia prevalence in infants: % of infants age 9–18 months with hemoglobin above 105 g/l | 91.6 | 91.8 | 0.3 | 92.6 | 93.5 | 94.0 | 2.2 | 0.7 | 95.5 | 1.4 |
| Diabetes control: % of all known diabetes patients with HbA1C <9% | 77.8 | 77.9 | 0.0 | 80.8 | 81.2 | 79.5 | 1.7 | 0.6 | 80.8 | 1.3 |
| LDL control: % of all known hyperlipidemia patients with LDL <100 mg/dla | 21.5 | 24.5 | 3.0 | 24.0 | 25.1 | 24.9 | 0.4 | 0.1 | 26.3 | 1.4 |
| Occult blood tests: Once every year for persons age 50–75 (%) | 26.8 | 26.8 | 0.1 | 34.0 | 37.0 | 36.1 | 9.2 | 3.2 | 37.6 | 1.6 |
| Mammography tests rates: Once every 2 years, for women age 50–75 (%) | 50.3 | 56.0 | 5.8 | 62.1 | 65.2 | 64.2 | 8.1 | 2.8 | 62.8 | −1.4 |
| Influenza annual immunization rate b: In target populations (≥65 years of age or chronically ill) (%) | 28.5 | 28.5 | 0.0 | 33.4 | 36.0 | 43.5 | 15.1 | 5.3 | 46.1 | 2.6 |
| Nonintervention clinics | ||||||||||
| QUIDS‐7 | 62.3 | 63.4 | 1.8 | 64.6 | 65.1 | 65.1 | 2.7 | 0.9 | 65.7 | 0.9 |
| Blood pressure control: % of all known hypertensive patients with blood pressure at or below 160/100 mmHg | 90.3 | 91.7 | 1.4 | 93.0 | 94.6 | 94.8 | 3.1 | 1.1 | 95.2 | 0.4 |
| Anemia prevalence in infants: % of infants age 9–18 months with hemoglobin above 105 g/l | 94.1 | 94.6 | 0.6 | 94.5 | 95.2 | 95.2 | 0.6 | 0.2 | 96.2 | 1.0 |
| Diabetes control: % of all known diabetes patients with HbA1C <9% | 86.9 | 86.5 | −0.4 | 87.9 | 88.1 | 86.8 | 0.4 | 0.1 | 87.5 | 0.7 |
| LDL control: % of all known hyperlipidemia patients with LDL <100 mg/dla | 25.3 | 27.8 | 2.5 | 26.0 | 26.4 | 26.0 | −1.9 | −0.6 | 27.5 | 1.5 |
| Occult blood tests: Once every year for persons age 50–75 (%) | 29.9 | 30.5 | 0.6 | 33.8 | 34.5 | 34.4 | 3.9 | 1.3 | 34.8 | 0.4 |
| Mammography tests rates: Once every 2 years, for women age 50–75 (%) | 61.4 | 65.3 | 3.9 | 68.2 | 68.7 | 67.2 | 1.9 | 0.6 | 68.3 | 1.1 |
| Influenza annual immunization rate b: In target populations (≥65 years of age or chronically ill) (%) | 39.7 | 39.7 | 0.0 | 40.1 | 39.9 | 44.0 | 4.3 | 1.5 | 43.1 | −0.8 |
Excluding those high‐risk patients with CHD, CVA, and diabetes, as well as those who did not have an LDL lab test result recorded.
Influenza immunizations are only taken once per year, therefore the 2008 measure did not change from March to December 2008.
Bold values represent percent changes according to the column headings.
During the preintervention period (December 2007–December 2008), there were slight improvements in most of the indicators in the 55 target clinics. Increases in the percentages for six of the seven indicators (all but LDL control) were considerably more pronounced during the intervention phase (Table 1a), with the largest differences observed in the process measures. Control of diabetes and LDL demonstrated the smallest change from baseline to the end of the active intervention period, with a 1.7 and 0.4 percent increase, respectively. It should also be noted that most of the change during the active intervention period occurred during the first year (December 2008–December 2009). During the postintervention follow‐up period, results were sustained, with even further improvement observed for all measures except mammography tests, which decreased by 1.4 percent. Percentages of all indicators remained above the preintervention rates.
Six of the seven quality indicators measured at the nonintervention clinics improved slightly from 2008 through 2011, demonstrating a trend similar to that observed in the intervention clinics (Table 1b). Minimal change in the quality indicators was observed in the nonintervention clinics during the postintervention phase.
During the course of the intervention, the gap in the composite QUIDS‐7 score for all seven quality indicators decreased by 66.7 percent (p < .001). The slope of the decline in the disparity gap was significantly steeper during the intervention period (−0.01383 95 percent CI: −0.01384 to −0.01383) than in the preintervention (4.3 percent; −0.00440, 95 percent CI: −0.00442 to −0.00439) and postintervention (18.2 percent; −0.00664, 95 percent CI: −0.00666 to −0.00663) periods. Overall, both intervention and nonintervention clinics showed improvement in the focus quality indicators (QUIDS‐7) over the time of the study, with the intervention clinics improving at a significantly faster rate (Figure 1). When the larger set of 61 quality indicators was examined, a similar trend of improvement and reduction in disparities was observed (Figure 2). Furthermore, the gap for the QUIDS‐61 narrowed significantly by 70.5 percent (p < .001) from baseline to the end of 2011 (results not shown).
Figure 1.
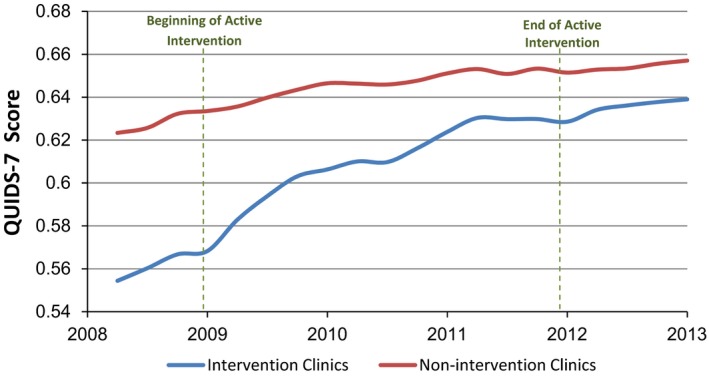
Intervention and Nonintervention Clinics' QUIDS‐7 Score
Figure 2.
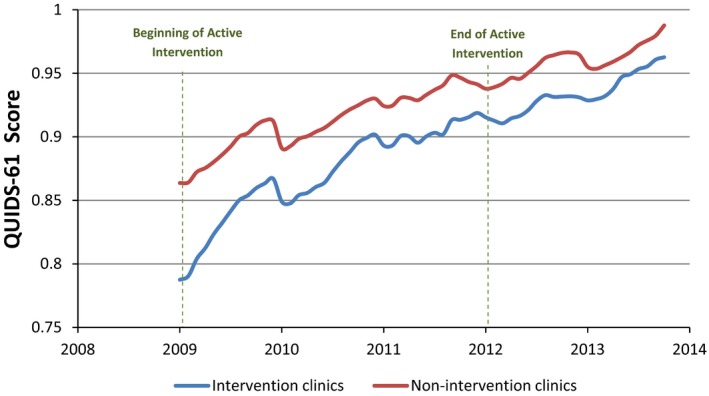
Intervention and Nonintervention Clinics' Composite Score of Sixty‐One Quality Measures
Discussion
We have demonstrated that a disparity reduction strategy implemented within a QI framework in a large health care organization achieved considerable improvements in quality indicators and a sustained reduction in health disparities between target intervention clinics serving primarily underprivileged populations and nonintervention clinics serving the general population. After 3 years of intervention, the gap between intervention and nonintervention clinics was reduced by 67 percent. Moreover, the reduction was sustained and further narrowed during the year postintervention, after the top‐down activities of the disparity reduction program ended.
Quality Improvement Coupled with Disparity Reduction
The importance of applying disparity reduction efforts across multiple diseases, conditions, and processes has been highlighted (Chin 2010) due to the overlapping nature of risk factors between health conditions and the potentially limited impact of intervening for single diseases (Gorin et al. 2012). Of the seven quality indicators, the greatest overall improvement was seen among the prevention‐focused process measures, likely because clinical processes are more easily influenced by systematic interventions than clinical outcomes (Ziemer et al. 2006; Chin 2010). Other studies were also able to increase the rates of influenza vaccination and cancer screening among disadvantaged populations as a result of a targeted intervention; however, most had small sample sizes (<2,000 patients in intervention groups) and interventions that were focused only on the target disease area (Beach et al. 2007; Humiston et al. 2011; Lasser et al. 2011; Hendren et al. 2013).
Despite the inherent difficulties in achieving improvements in outcome (Chin 2010), the observed modest change in blood pressure control and infant anemia prevention may be due to a ceiling effect with little room for improvement. The change in the lipid control, however, exhibited consistently low levels of attainment. This is likely due to controversies regarding the appropriateness of target levels for lipid control (Keaney, Curfman, and Jarcho 2014), as is reflected in the change in organizational guidelines for target LDL levels that occurred during the study period.
Closing Gaps and Sustainability
While previous health disparity interventions have also demonstrated improvements in quality health indicators, their results have not always sustained beyond the completion of the supervised intervention (Davis et al. 2007; Peek, Cargill, and Huang 2007; Bray et al. 2009). Our study shows that not only were achievements sustained after the focused 36‐month intervention period but gaps also continued to narrow, for a total reduction of 72.7 percent of the gap from the preintervention period to the end of the follow‐up period.
The fact that most of the change occurred during the first year of intervention perhaps indicates the ability to concentrate top‐down efforts during a shorter period while still achieving longer term effects. This possibility, however, should be further tested. Sustained improvements in the quality of care with simultaneous lasting reductions in disparities between intervention and nonintervention clinics may be attributable to the design of the strategy, which balanced between standardization and large‐scale implementation within a closed payer–provider system (top‐down) and tailoring interventions to the local population (bottom‐up). Through the top‐down approach, managerial‐driven programs potentially have a trickledown effect that creates organizational change and improves overall performance as well as health outcomes (Davis et al. 2007; Peek, Cargill, and Huang 2007). This change may have affected the overall reduction in gaps in the 61‐indicator measure, which, prior to the focused seven‐indicator intervention period, remained constant (with target and nonintervention clinics improving at a similar rate).
Limitations
Several limitations should be noted. First, changes to QI measures are an uncontrollable function of implementing an intervention in a real‐world setting. These changes in criteria (e.g., LDL target levels) ultimately have an impact on the consistency of outcomes measured in long‐term follow‐up phases of research studies. Second, both the SES and minority designations for Clalit members were defined at the clinic level. Although grouping patients into SES levels defined at the clinic level may contribute to a small percentage of mis‐categorized members, area‐level SES is useful for a clinic‐level analysis (Hammouche, Holland, and Steel 2011) as performed in this study and has been shown to be related to individual‐level SES measures (Shadmi et al. 2011). Lastly, the design of the evaluation precludes determination of causality. Nonetheless, as our pre‐ and postintervention trends show, it is likely that, without targeted disparity reduction efforts, improvement would have continued in all clinics, but gaps would have remained and potentially even widened.
Implications for Other Contexts
As health care legislation in the United States and other countries is put forth to encourage the creation of interventions to improve health care for disadvantaged populations, health organizations can aim to target disparity reduction within a framework of QI similar to the strategy employed in this study's program. This is particularly timely given the establishment of payer–provider organization partnerships, such as accountable care organizations and other integrated paradigms that are gaining traction as viable models to improve care delivery (Song and Lee 2013; Epstein et al. 2014) because of the “collective responsibility” assumed for the delivery of care among the providers and the inherent financial incentive to achieve sustained QI (Epstein et al. 2014).
Conclusion
In conclusion, the 36‐month disparity‐reduction efforts yielded scalable improvement in health outcomes and process measures, a narrowed health disparity gap (of about two‐thirds of the gap) from the preintervention period, and sustainable results that were measured 1 year postintervention. This health care organization‐led disparity reduction program within a QI framework was able to achieve a balance between standardization and large‐scale implementation within a closed payer–provider system and demonstrated sustained reduction in gaps in a wide‐array of health and care indicators.
Supporting information
Appendix SA1: Author Matrix.
Appendix SA2: Strategies and Interventions to Minimize Disparities Employed by Target Clinics at the Patient, Community, or Organization Level.
Acknowledgments
Joint Acknowledgment/Disclosure Statement: We would like to thank Jenna M. Berent for her valuable contribution in editing and reviewing the manuscript.
Disclosures: None.
Disclaimers: None.
References
- Balicer, R. D. , Shadmi E., Lieberman N., Greenberg‐Dotan S., Goldfracht M., Jana L., Cohen A. D., Regev‐Rosenberg S., and Jacobson O.. 2011. “Reducing Health Disparities: Strategy Planning and Implementation in Israel's Largest Health Care Organization.” Health Services Research 46 (4): 1281–99. [DOI] [PMC free article] [PubMed] [Google Scholar]
- Beach, M. L. , Flood A. B., Robinson C. M., Cassells A. N., Tobin J. N., Greene M. A., and Dietrich A. J.. 2007. “Can Language‐Concordant Prevention Care Managers Improve Cancer Screening Rates?” Cancer Epidemiology, Biomarkers & Prevention 16 (10): 2058–64. [DOI] [PubMed] [Google Scholar]
- Bray, P. , Cummings D. M., Wolf M., Massing M. W., and Reaves J.. 2009. “After the Collaborative Is Over: What Sustains Quality Improvement Initiatives in Primary Care Practices?” The Joint Commission Journal on Quality and Patient Safety 35 (10): 502–8. [DOI] [PubMed] [Google Scholar]
- Chin, M. H. 2010. “Quality Improvement Implementation and Disparities: The Case of the Health Disparities Collaboratives.” Medical Care 48 (8): 668–75. [DOI] [PMC free article] [PubMed] [Google Scholar]
- Chin, M. H. , and Chien A. T.. 2006. “Reducing Racial and Ethnic Disparities in Health Care: An Integral Part of Quality Improvement Scholarship.” Quality & Safety in Health Care 15 (2): 79–80. [DOI] [PMC free article] [PubMed] [Google Scholar]
- Chin, M. H. , Walters A. E., Cook S. C., and Huang E. S.. 2007. “Interventions to Reduce Racial and Ethnic Disparities in Health Care.” Medical Care Research and Review 64 (5 Suppl): 7S–28S. [DOI] [PMC free article] [PubMed] [Google Scholar]
- Chin, M. H. , Clarke A. R., Nocon R. S., Casey A. A., Goddu A. P., Keesecker N. M., and Cook S. C.. 2012. “A Roadmap and Best Practices for Organizations to Reduce Racial and Ethnic Disparities in Health Care.” Journal of General Internal Medicine 27 (8): 992–1000. [DOI] [PMC free article] [PubMed] [Google Scholar]
- Cooper, L. A. , Marsteller J. A., Noronha G. J., Flynn S. J., Carson K. A., Boonyasai R. T., Anderson C. A., Aboumatar H. J., Roter D. L., Dietz K. B., Miller E. R., Prokopowicz G. P., Dalcin A. T., Charleston J. B., Simmons M., and Huizinga M. M.. 2013. “A Multi‐Level System Quality Improvement Intervention to Reduce Racial Disparities in Hypertension Care and Control: Study Protocol.” Implementation Science 8: 60–75. [DOI] [PMC free article] [PubMed] [Google Scholar]
- Davis, A. M. , Vinci L. M., Okwuosa T. M., Chase A. R., and Huang E. S.. 2007. “Cardiovascular Health Disparities: A Systematic Review of Health Care Interventions.” Medical Care Research and Review 64 (5 Suppl): 29S–100S. [DOI] [PMC free article] [PubMed] [Google Scholar]
- Epstein, A. M. , Jha A. K., Orav E. J., Liebman D. L., Audet A.‐M. J., Zezza M. A., and Guterman S.. 2014. “Analysis of Early Accountable Care Organizations Defines Patient, Structural, Cost, and Quality‐of‐Care Characteristics.” Health Affairs 33 (1): 95–102. [DOI] [PubMed] [Google Scholar]
- Fiscella, K. , Franks P., Gold M. R., and Clancy C. M.. 2000. “Inequality in Quality: Addressing Socioeconomic, Racial, and Ethnic Disparities in Health Care.” Journal of the American Medical Association 283 (19): 2579–84. [DOI] [PubMed] [Google Scholar]
- Gorin, S. S. , Badr H., Krebs P., and Prabhu Das I.. 2012. “Multilevel Interventions and Racial/Ethnic Health Disparities.” Journal of the National Cancer Institute Monographs 44: 100–11. [DOI] [PMC free article] [PubMed] [Google Scholar]
- Hammouche, S. , Holland R., and Steel N.. 2011. “Does Quality of Care for Hypertension in Primary Care Vary with Postcode Area Deprivation? An Observational Study.” BMC Health Services Research 11: 297. [DOI] [PMC free article] [PubMed] [Google Scholar]
- Haws, R. A. , Thomas A. L., Bhutta Z. A., and Darmstadt G. L.. 2007. “Impact of Packaged Interventions on Neonatal Health: A Review of the Evidence.” Health Policy and Planning 22 (4): 193–215. [DOI] [PubMed] [Google Scholar]
- Hendren, S. , Winters P., Humiston S., Idris A., Li S. X. L., Ford P., Specht R., Marcus S., Mendoza M., and Fiscella K.. 2013. “Randomized, Controlled Trial of a Multimodal Intervention to Improve Cancer Screening Rates in a Safety‐Net Primary Care Practice.” Journal of General Internal Medicine 29 (1): 41–9. [DOI] [PMC free article] [PubMed] [Google Scholar]
- Humiston, S. G. , Bennett N. M., Long C., Eberly S., Arvelo L., Stankaitis J., and Szilagyi P. G.. 2011. “Increasing Inner‐City Adult Influenza Vaccination Rates: A Randomized Controlled Trial.” Public Health Reports 126 (Suppl): 39–47. [DOI] [PMC free article] [PubMed] [Google Scholar]
- Israeli Central Bureau of Statistics . 2008. “Characterization and Classification of Geographical Units by the Socio‐Economic Level of the Population 2008.” [accessed on April 9, 2014]. Available at http://147.237.248.50/webpub/pub/text_page_eng.html?publ=100&CYear=2008&CMonth=1
- Keaney, J. F. , Curfman G. D., and Jarcho J. A.. 2014. “A Pragmatic View of the New Cholesterol Treatment Guidelines.” New England Journal of Medicine 370 (3): 275–8. [DOI] [PubMed] [Google Scholar]
- Koh, H. K. , Oppenheimer S. C., Massin‐Short S. B., Emmons K. M., Geller A. C., and Viswanath K.. 2010. “Translating Research Evidence into Practice to Reduce Health Disparities: A Social Determinants Approach.” American Journal of Public Health 100 (Suppl): S72–80. [DOI] [PMC free article] [PubMed] [Google Scholar]
- Lasser, K. E. , Murillo J., Lisboa S., Casimir N., Valley‐Shah L., Emmons K. M., Fletcher R. H., and Ayanian J. Z.. 2011. “Colorectal Cancer Screening among Ethnically Diverse, Low‐Income Patients.” Archives of Internal Medicine 171 (10): 906–12. [DOI] [PubMed] [Google Scholar]
- Lurie, N. , Jung M., and Lavizzo‐Mourey R.. 2005. “Disparities and Quality Improvement: Federal Policy Levers.” Health Affairs 24 (2): 354–64. [DOI] [PubMed] [Google Scholar]
- Marmot, M. , Allen J., Goldblatt P., Boyce T., McNeish D., Grady M., and Geddes I.. 2010. Fair Society, Healthy Lives‐The Marmot Review Executive Summary: Strategic Review of Health Inequalities in England Post‐2010. London: The Marmot Review. [Google Scholar]
- McPheeters, M. L. , Kripalani S., Peterson N. B., Idowu R. T., Jerome R. N., Potter S. A., and Andrews J. C.. 2012. Quality Improvement Interventions to Address Health Disparities, Closing the Quality Gap: Revisiting the State of the Science. Evidence Report/Technology Assessment, Number 209. Washington, D.C.: Agency for Healthcare Research and Quality. [PMC free article] [PubMed] [Google Scholar]
- Miranda, J. , Duan N., Sherbourne C., Schoenbaum M., Lagomasino I., Jackson‐triche M., and Wells K. B.. 2003. “Improving Care for Minorities: Can Quality Improvement Interventions Improve Care and Outcomes for Depressed Minorities? Results of a Randomized, Controlled Trial.” Health Services Research 38 (2): 613–30. [DOI] [PMC free article] [PubMed] [Google Scholar]
- OECD . 2012. Reviews of Health Care Quality: Israel, Executive Summary, Assessment and Recommendations [accessed March 7, 2015]. Available at http://www.oecd.org/els/health-systems/ReviewofHealthCareQualityISRAEL_ExecutiveSummary.pdf [Google Scholar]
- Peek, M. E. , Cargill A., and Huang E. S.. 2007. “Diabetes Health Disparities: A Systematic Review of Health Care Interventions.” Medical Care Research and Review 64 (5 Suppl): 101S–56S. [DOI] [PMC free article] [PubMed] [Google Scholar]
- Sequist, T. D. , Fitzmaurice G. M., Marshall R., Shaykevich S., Marston A., Safran D. G., and Ayanian J. Z.. 2010. “Cultural Competency Training and Performance Reports to Improve Diabetes Care for Black Patients.” Annals of Internal Medicine 152 (1): 40–6. [DOI] [PubMed] [Google Scholar]
- Shadmi, E. , Balicer R. D., Kinder K., Abrams C., and Weiner J. P.. 2011. “Assessing Socioeconomic Health Care Utilization Inequity in Israel: Impact of Alternative Approaches to Morbidity Adjustment.” BMC Public Health 11: 609. [DOI] [PMC free article] [PubMed] [Google Scholar]
- Song, Z. , and Lee T. H.. 2013. “The Era of Delivery System Reform Begins.” Journal of the American Medical Association 309 (1): 35–6. [DOI] [PMC free article] [PubMed] [Google Scholar]
- Ziemer, D. C. , Doyle J. P., Barnes C. S., Branch W. T. Jr, Cook C. B., El‐Kebbi I. M., Gallina D. L., Kolm P., Rhee M. K., and Phillip L. S.. 2006. “An Intervention to Overcome Clinical Inertia and Improve Diabetes Mellitus Control in a Primary Care Setting.” Archives of Internal Medicine 166 (5): 507–13. [DOI] [PubMed] [Google Scholar]
Associated Data
This section collects any data citations, data availability statements, or supplementary materials included in this article.
Supplementary Materials
Appendix SA1: Author Matrix.
Appendix SA2: Strategies and Interventions to Minimize Disparities Employed by Target Clinics at the Patient, Community, or Organization Level.