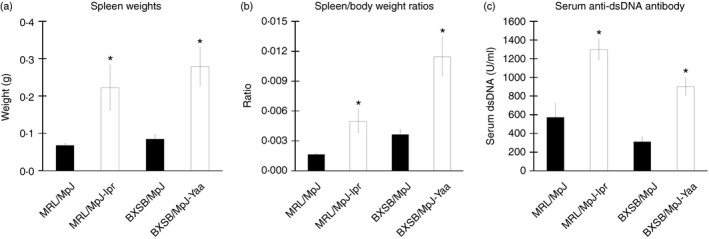
Figure 1.

Indices of autoimmune disease onset in mice. Graph showing the spleen weight (n = 5 mice for each strain) (a), spleen weight to body weight ratio (n = 5 mice for each strain) (b), and serum anti‐double‐stranded DNA (anti‐dsDNA) level (n = 4 mice for each strain) (c). Statistically significant difference, as determined using the Mann–Whitney U‐test (P < 0·05), between autoimmune disease models (MRL/MpJ‐lpr and BXSB/MpJ‐Yaa) and the control strains (MRL/MpJ, BXSB/MpJ), respectively, is indicated, *P < 0·05. Values are shown as the means ± SE.
