Figure 3.

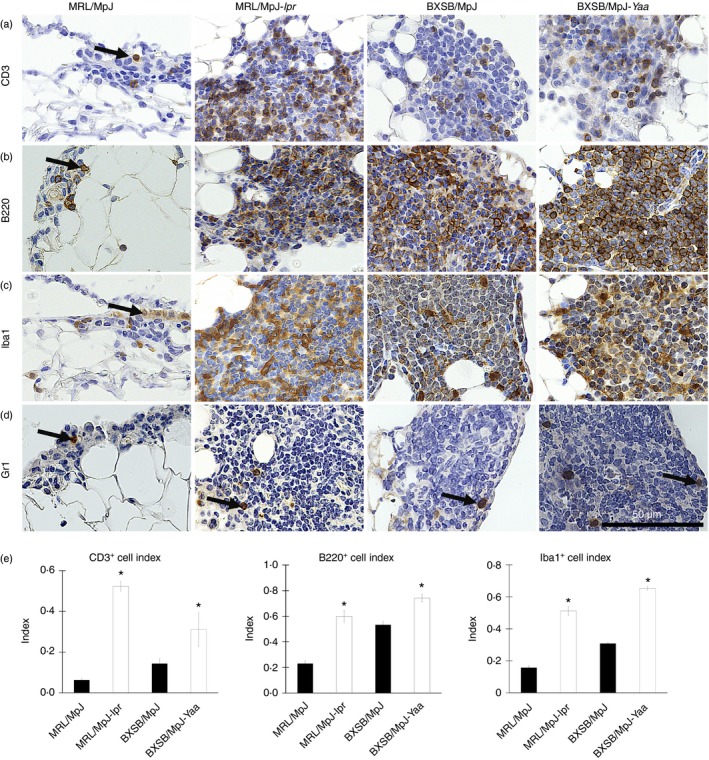
Immune cells from mediastinal fat‐associated lymphoid clusters (MFALCs) in mice. Light microscopic photographs showing immunohistochemical staining of mouse MFALCs with CD3 (a), B220 (b), Iba1 (c), and Gr1 (d). Numerous CD3‐positive T cells, B220‐positive B cells, and Iba1‐positive macrophages (a–c), but only a few Gr1‐positive granulocytes (d), are present in mouse MFALCs, and their appearance differs between the strains. Arrows indicate immunopositive cells. Bars (a–d) = 100 μm. Graphs showing the indices of immunopositive cells for CD3 (a), B220 (b), and Iba1 (c) in MRL/MpJ, MRL/MpJ‐lpr, BXSB/MpJ, and BXSB/MpJ‐Yaa mice (e). Statistically significant difference, as determined using the Mann–Whitney U‐test; n = 5 mice for each strain, between autoimmune disease models (MRL/MpJ‐lpr and BXSB/MpJ‐Yaa) and the control strains (MRL/MpJ, BXSB/MpJ), respectively, is indicated (*P < 0·05). Values are shown as the means ± SE.
