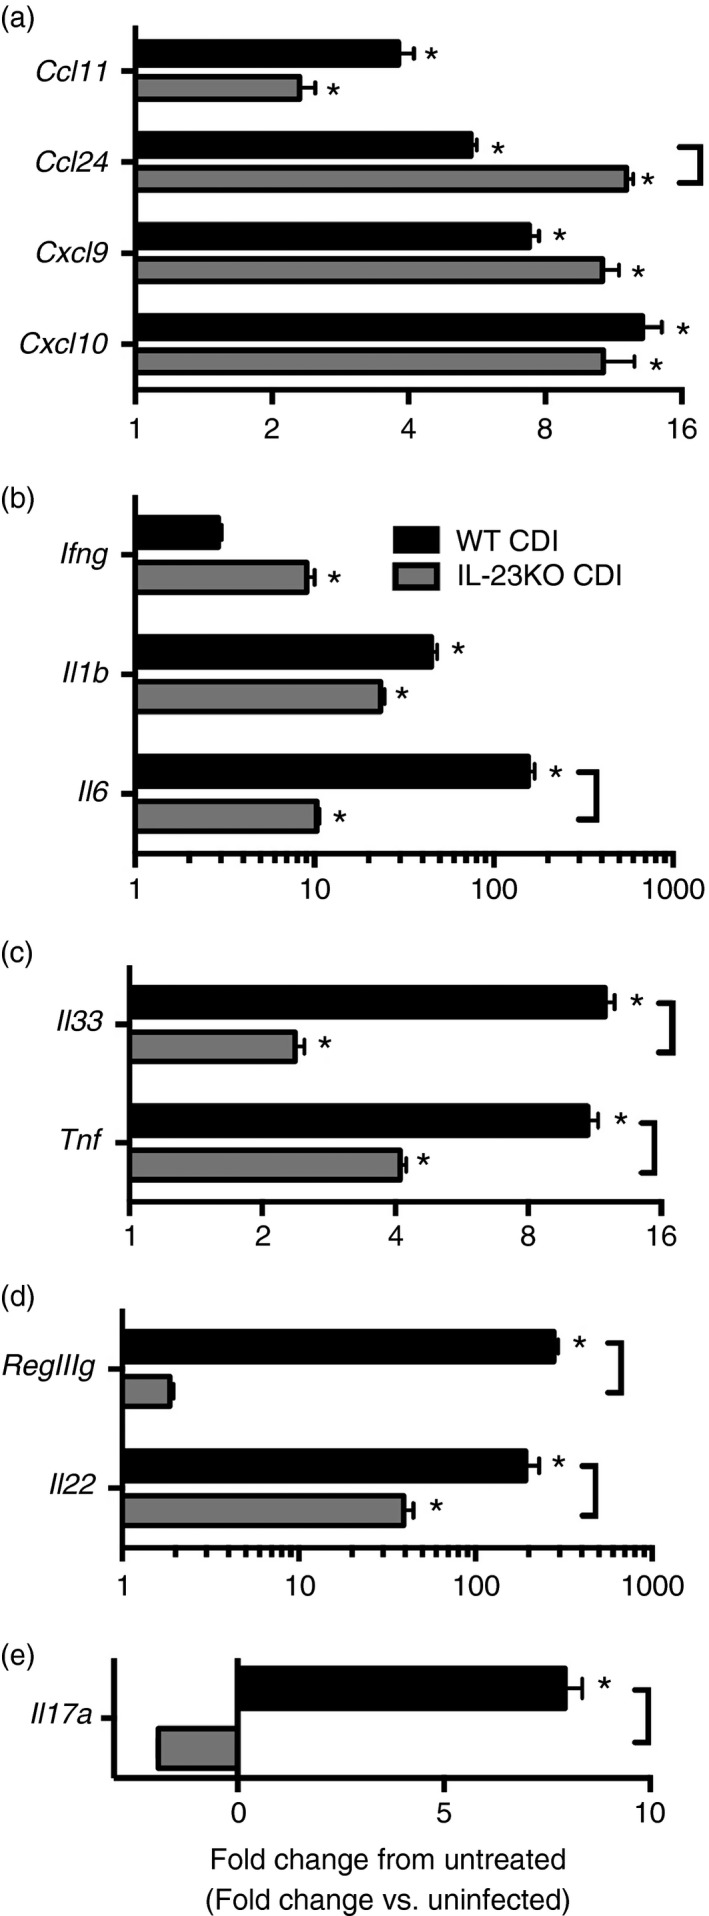
Figure 2.

Effect of interleukin‐23 (IL‐23) deficiency on colonic (a) chemokine and (b–e) inflammatory cytokine expression during Clostridium difficile colitis. Host gene expression was measured as outlined in the methods. n ≥ 6 per group. Data are shown as mean ± SEM fold change gene expression of wild‐type (WT) C. difficile‐infected (black bars) and IL‐23KO C. difficile‐infected (grey bars) animals compared with untreated WT mice. CDI = C. difficile infected. *P < 0·05 compared with untreated WT animals. Brackets indicate P < 0·05 for the differences between indicated groups.
