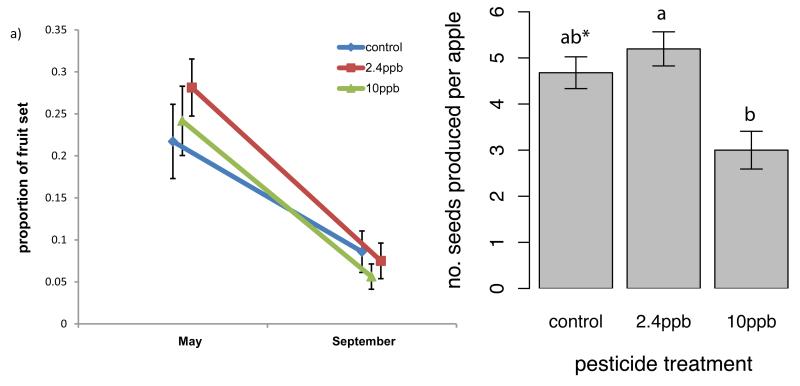
Figure 2.
Impacts of pesticide treatment on fruit and seed set. (a) The change in proportion of fruit set for trees pollinated by colonies exposed to different pesticide treatments measured early (May) and late (September), which represents fruit abortion level, and (b) number of seeds produced per apple pollinated by colonies exposed to different pesticide treatments. Means ± SE are shown, and different letters indicate significant differences (p<0.05, * indicates a difference of p=0.06 between control and 10ppb).

