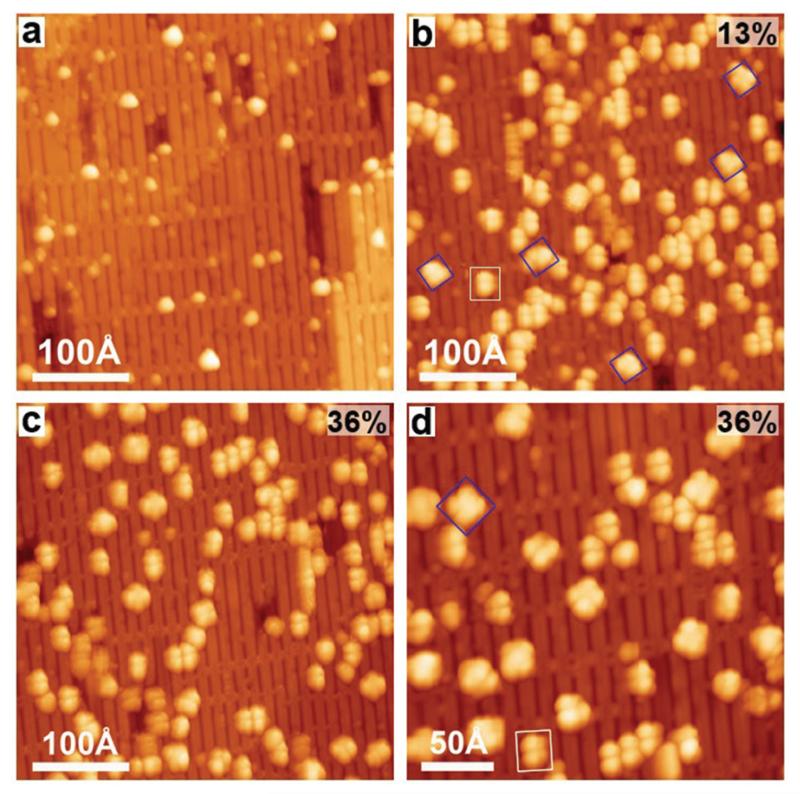
Fig. 7.
Constant-current STM images taken after (a) the deposition of Ni onto TiO2(110)-1 × 2, θNi = 0.02, (b) the deposition of 2HTPP onto Ni/TiO2(110) at 300 K (Ni : 2HTPP = 1 : 1), and (c) the subsequent heating of the sample (b) to 550 K, and (d) the magnified STM image of the same sample as in (c). Two types of molecules are labelled with white rectangles and blue squares. Tunnelling parameters: (a) I = 0.07 nA; (b) I = 0.08 nA; (c, d) I = 0.04 nA; in all cases U = −2.2 V. The average metalation degree (error ± 8%) of 2HTPP is shown on the upper right corners of the panels b–d.

