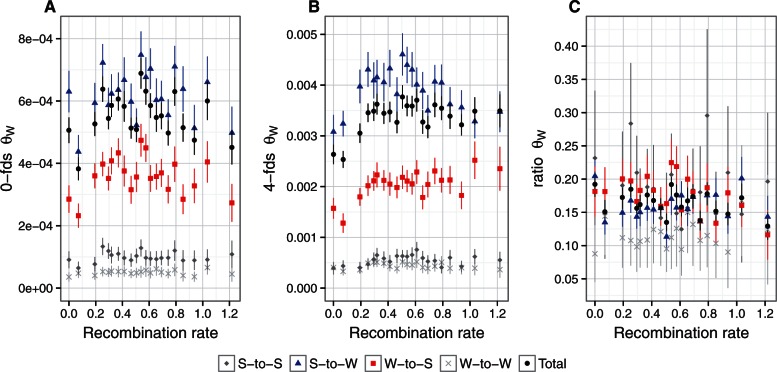
Fig. 4.
Relationship between recombination rate and diversity estimates (θW) for different mutation categories: S-to-S (dark gray); S-to-W (blue); W-to-S (red); W-to-W (light gray); total θW (black). Mean recombination rate per bin was log10 transformed, after adding a constant of 1. (A) θW for 0-fold degenerated sites. (B) θW for 4-fold degenerated sites. (C) the ratio of θW at 0-fold to 4-fold degenerated sites.

