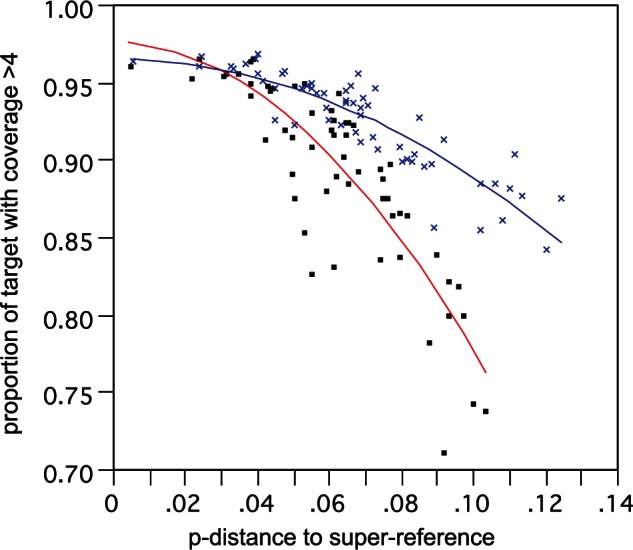
Fig. 7.

Correlation of proportion of target recovered versus distance from SR. Analysis based on a test subset of 59 samples. Lines show two-degree polynomial best fit for direct SR mapping (red line, black squares) and assembly-based TASR mapping (blue line, blue crosses).
