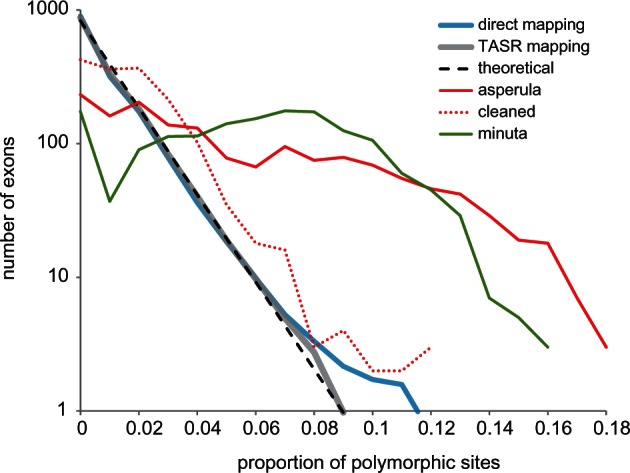
Fig. 8.

Distribution of exon polymorphism. The thick lines show average distribution of proportion of polymorphic sites per exon across a 44-sample test set: Blue direct SR mapping, gray assembly-based TASR mapping. The dashed line shows a log-linear coalescent expectation. The red lines show Ophiactis asperula F167536 before and after filtering of contaminating reads. The putative polyploid/hybrid Amphistigma minuta F173962 is shown in green.
