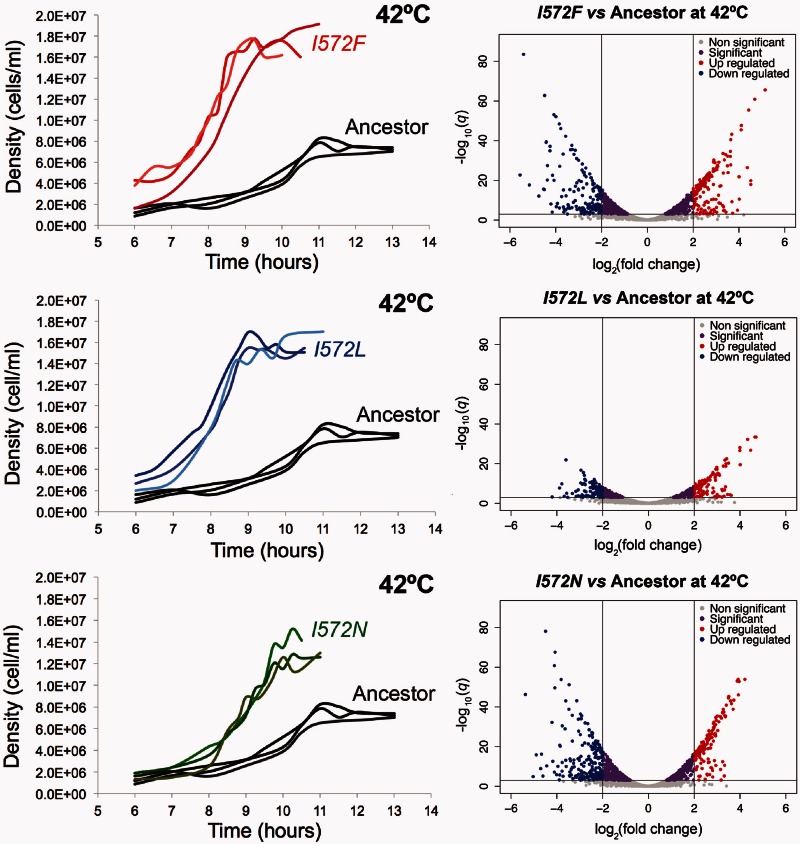
Fig. 3.
Phenotypic characterization of the mutants compared with the ancestor at 42 °C. The left side of the figure shows the growth curves of the ancestor and the mutants grown at 42 °C (three replicates per each genotype). The right side of the figure shows the volcano plots showing the global differential expression of genes (represented as dots) between the mutants grown at 42 °C and the ancestor grown at 42 °C. Colors represent status with respect to 2-fold expression difference, represented by two vertical lines, and a significance at q = 0.001, represented by an horizontal line.

