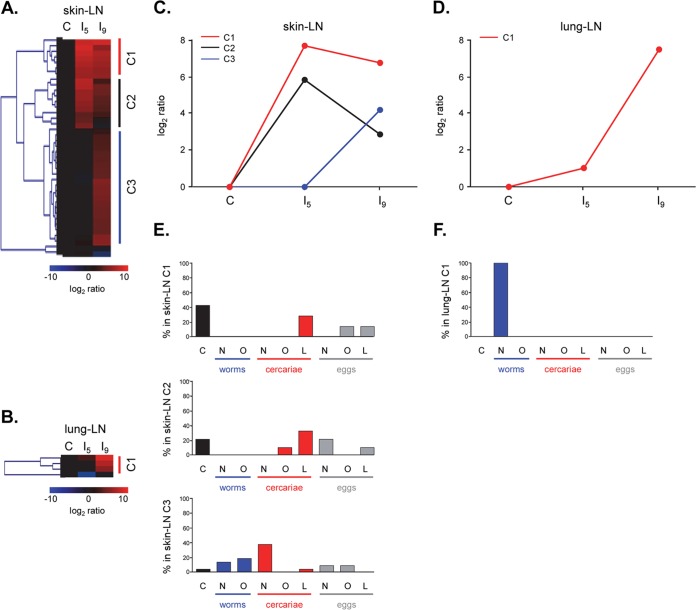
FIG 2.
(A and B) Hierarchical-clustering analysis of log2-transformed median fluorescence intensities with background subtracted, classifying the antiglycan IgM responses in skin LN (A) and lung LN (B) into three and one major cluster(s), respectively. (C and D) Fluorescence intensity signals were averaged for each cluster and showed different response profiles for skin LN IgM (C) and for lung LN IgM (D). (E and F) Distribution of glycan origins within each skin LN (E) and lung LN (F) glycan cluster. C, (synthetic) glycoconjugates; N, N-glycan; O, O-glycan; L, GSL glycan.

