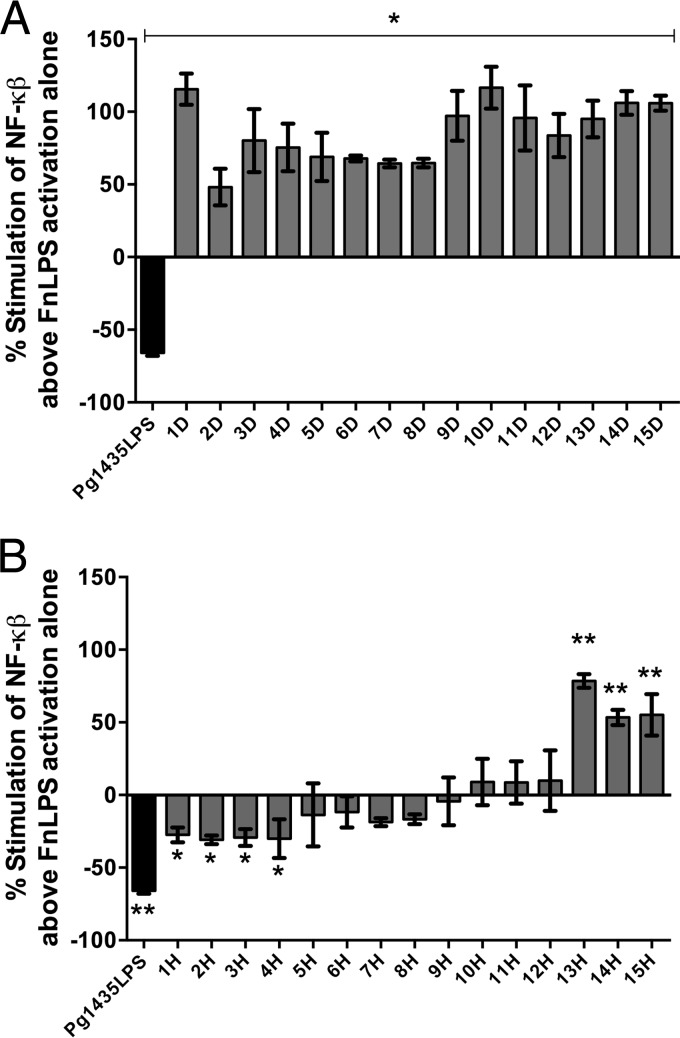
FIG 4.
TLR4 antagonistic or stimulatory potential of matched diseased (A) and healthy (B) subgingival plaque. Each patient was designated a number and “D” or “H” label corresponds to diseased or healthy plaque, respectively. The percent stimulation of NF-κB above that of F. nucleatum LPS (FnLPS) activation alone was calculated by using the formula [(y − x)/x] × 100, where x is the NF-κB activity due to TLR4 stimulation with 100 ng/ml FnLPS alone, and y is activity of FnLPS combined with either plaque at 100 μg ml−1 or Pg1435LPS control at 1 μg ml−1. The results shown are means ± the standard deviations of triplicate wells determined in one of three independent assays. *, P < 0.05; **, P < 0.01.

