FIG 1.
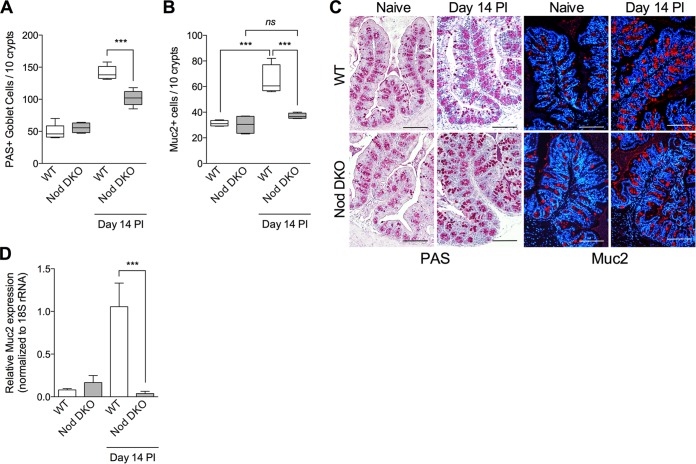
Intestinal goblet cells and Muc2 production in Nod DKO and wild-type (WT) mice with or without T. muris infection. Nod DKO and WT mice were infected with T. muris and were sacrificed on day 14 p.i. (A) Numbers of PAS-stained goblet cells. (B) Numbers of Muc2+ cells, as assessed by immunohistochemistry. (C) Representative images of PAS- and Muc2-stained intestinal sections in Nod DKO and WT mice with or without T. muris infection. (D) Muc2 expression in intestinal tissue using real-time PCR. Data are presented as means, with error bars representing SEM, or box and whisker plots. Magnification, ×200; bars, 100 μm. Groups were compared using Tukey's multiple comparison posttest. For box and whisker plots, the horizontal line within the box indicates the median, boundaries of the box indicates the 25th and 75th percentiles, and whiskers indicate the highest and lowest values of the results. ***, P < 0.001 (n = 5 for uninfected groups; n = 7 for infected groups); ns, not significant.

