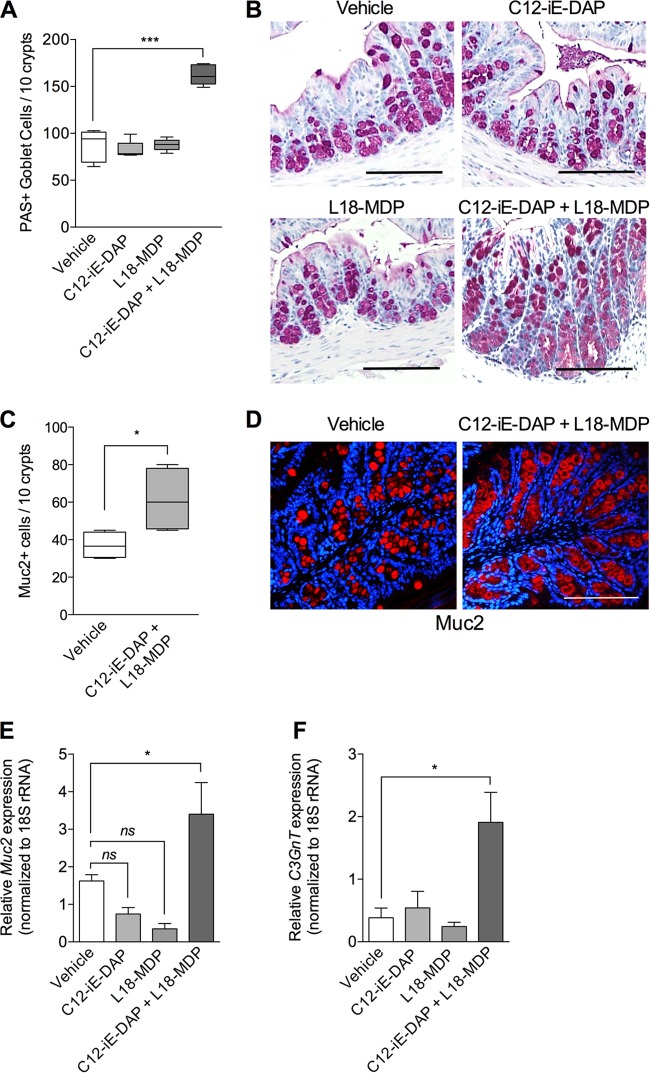
FIG 3.
Numbers of intestinal goblet cells and levels of Muc2 and C3Gnt expression in naive mice after treatment with Nod1 and Nod2 agonists. Naive C57BL/6 mice were treated (intrarectally, single dose) with either a Nod1 agonist (C12-iE-DAP), a Nod2 agonist (L18-MDP), both Nod1 and Nod2 agonists, or vehicle (PBS). Mice were sacrificed 72 h posttreatment. (A) Numbers of PAS-stained goblet cells in colon tissue. (B) Representative images of PAS-stained intestinal sections. (C) Numbers of Muc2+ cells, as assessed by immunohistochemistry. (D) Representative immunostaining for murine Muc2 (red) and counterstaining with DAPI (blue) in vehicle-treated mice and mice treated with both Nod1 and Nod2 agonists (C12-iE-DAP + L18-MDP. (E) Muc2 gene expression in intestinal tissue sections, assessed by using real-time PCR. (F) C3GnT gene expression in colon tissue sections, assessed by using real-time PCR. Magnification, ×200; bars, 100 μm. Groups were compared using Tukey's multiple comparison posttest. Data are represented as means, and error bars represent SEM (5 mice per group). ***, P < 0.001; *, P < 0.05; ns, not significant.

