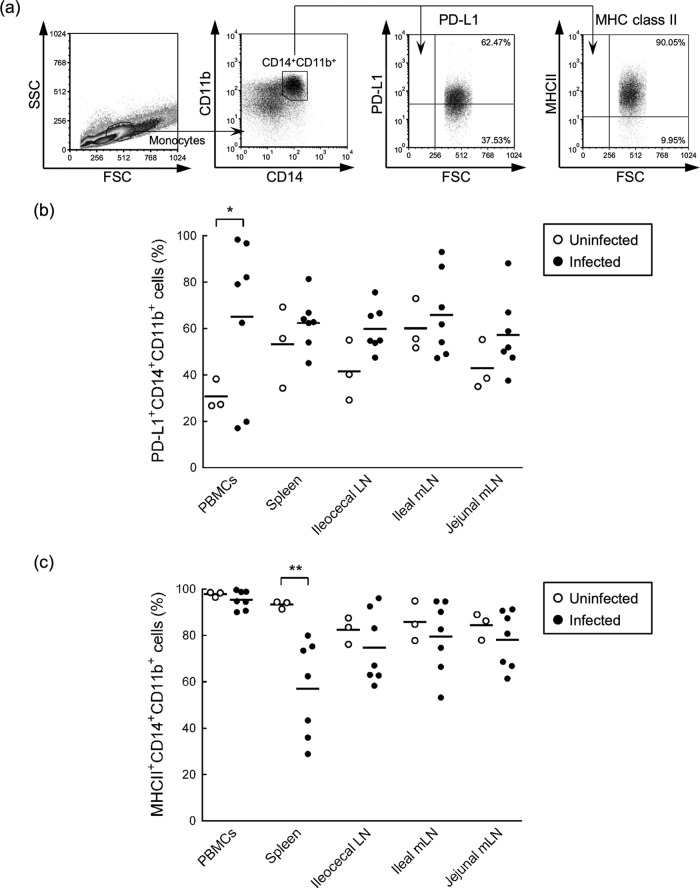
FIG 4.
Expression levels of PD-L1 and MHC-II on macrophages in M. avium subsp. paratuberculosis-infected cattle. (a) Gating strategy and representative dot plots for expression analysis of PD-L1 and MHC-II on CD14+ CD11b+ macrophages from the blood of M. avium subsp. paratuberculosis-infected cattle. Values in the quadrant indicate the percentages of the cells. (b and c) Percentages of PD-L1-expressing (b) and MHC-II-expressing (c) cells among CD14+ CD11b+ cells of peripheral blood, spleen, ileocecal LNs, and ileal and jejunal mLNs from uninfected cattle (n = 3) and M. avium subsp. paratuberculosis-infected cattle (n = 7). Comparisons of groups were performed using Welch's t test. Differences were considered significant when P < 0.05 (*, P < 0.05; **, P < 0.01). See also Table S2 in the supplemental material for individual expression analyses.

