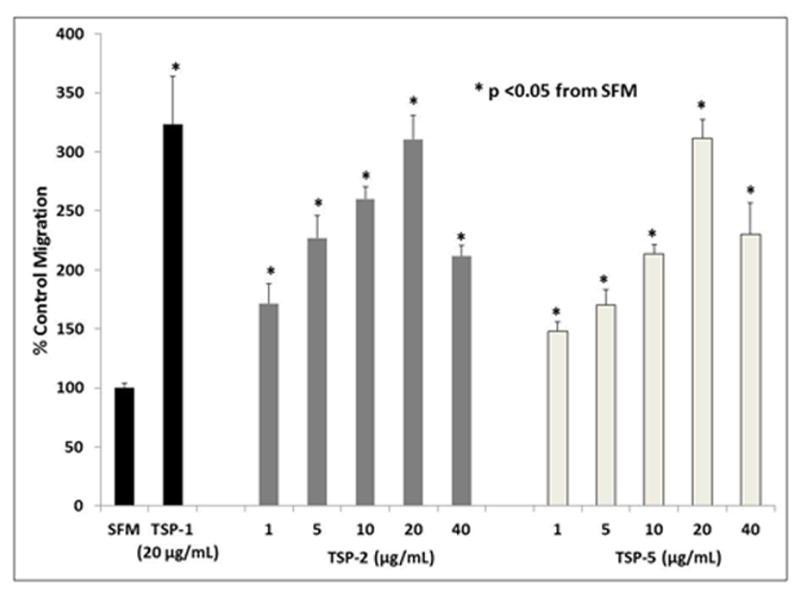
Figure 1.

VSMC migration curve for TSP-2 and TSP-5, compared to SFM and TSP-1. Quiescent VSMCs were plated in a micro-Boyden chemotaxis chamber for 4 hours, using 1μg/mL to 40 μg/ml of TSP-2 or TSP-5 as chemoattractants. SFM and 20μg/mL TSP-1 acted as negative and positive controls respectively. Migration was assessed as cells counted per five high-powered fields, normalized to SFM, analyzed by ANOVA (p <0.05).
