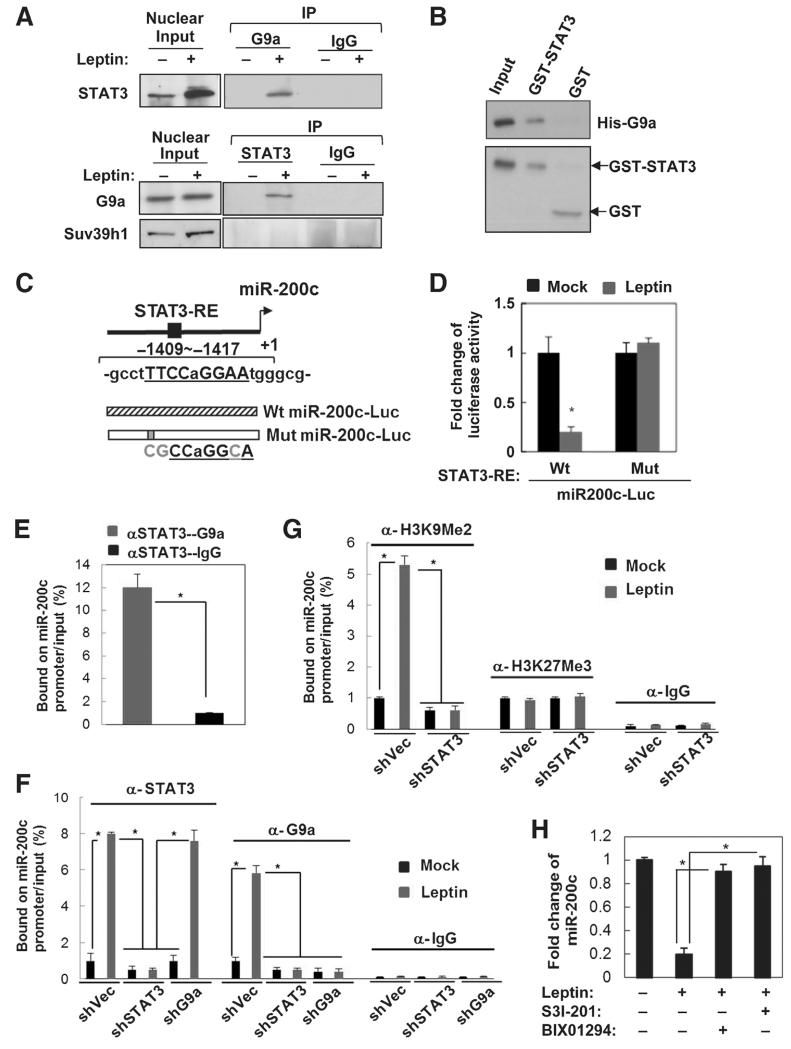
Figure 2.
Leptin-activated STAT3 recruits G9a to repress miR-200c via H3K9Me2 mediated gene silencing. A, reciprocal coimmunoprecipitation assay showing interaction between endogenous nuclear STAT3 and G9a in leptin-treated MCF7 cells (Input, 10% nuclear extract). B, GST pull-down assay showing direct association of GST-STAT3 and His-G9a in vitro. C, diagram showing MiR-200c promoter with the putative STAT3 response element (STAT3-RE, underline), and the structure of luciferase reporters driven by MiR-200c promoter with the wild-type (Wt) and mutated STAT3-RE (Mut, mutations are in gray). D, fold change of luciferase activity driven by MiR-200c promoter with the wild-type or mutated STAT3-RE under leptin treatment in MCF7 cells (n = 3; *, P < 0.05). E, sequential ChIP-PCR analysis showing the percentage of STAT3-G9a complex bound MiR200c promoter chromatin/input chromatin in leptin-treated MCF7 cells (n = 3; *, P < 0.05). IgG was used as a negative control. ChIP-PCR analysis showing the percentage of STAT3/G9a (F)- and H3K9Me2/H3K27Me3 (G)-bound MiR-200c promoter chromatin/input chromatin in MCF7 cells that expressed shSTAT3 along with leptin treatment. n = 3; *, P < 0.05. H, fold change of miR-200c expression in MCF7 cells under leptin and S3I-201/BIX01294 treatment. n = 3; *, P < 0.05. Error bars, ±SD.

