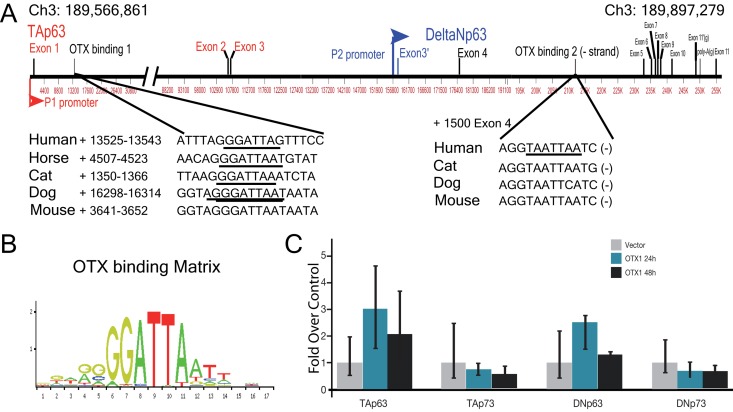
Figure 1. Promoter analysis of p63 gene.
(A) Genomic location and structure of human p63 gene, showing the position and size of the different intron and exons. In lower panels are identified, the location position of OTX responsive elements, and their conservation in different species. (B) Detailed structure of p63 gene. (C) OTX2 binding element, matrix Jaspar PH0130.1.

