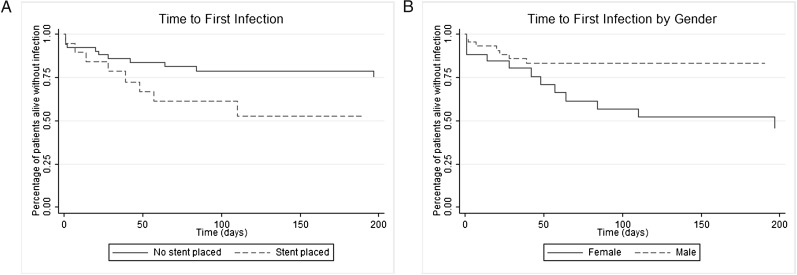
Figure 1.
Kaplan-Meier plots of time to first infection. A, Stent vs no stent. Patients with stents (dashed line) had a significantly shorter time to infection than did patients without stents (solid line). B, Male vs female patients. Female patients (solid line) had a significantly shorter time to infection than did male patients (dashed line).

