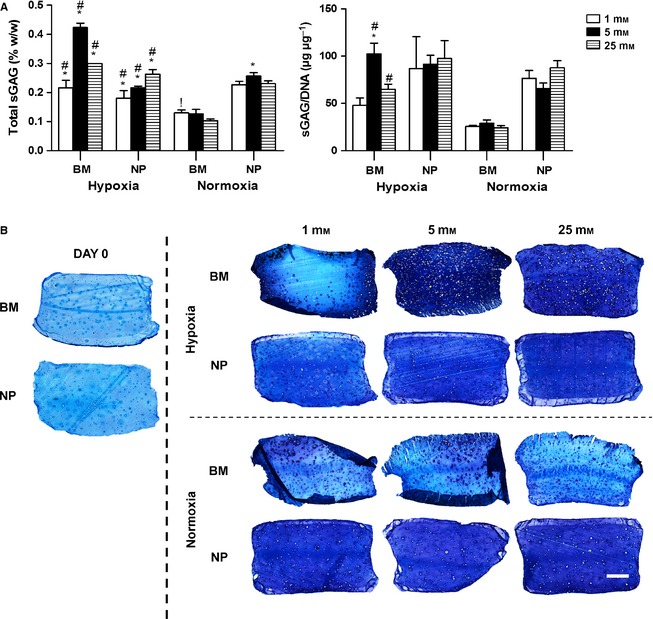
Figure 2.

(A) Total sGAG normalised to wet weight and to DNA content at day 21 for nucleus pulposus (NP) and bone marrow (BM) stem cells maintained under different glucose conditions (1, 5, 25 mM) in hypoxia (5% O2) or normoxia (20% O2): #significance compared with normoxia for same cell type, !significance compared with 25 mM glucose condition for same cell type, *significance compared with the two other glucose conditions for the same cell type (P < 0.05). (B) Histological evaluation with aldehyde fuchsin and alcian blue to identify sGAG at day 0 and day 21; deep blue/purple staining indicates GAG accumulation and light blue staining indicates residual alginate. Scale bar: 1 mm.
