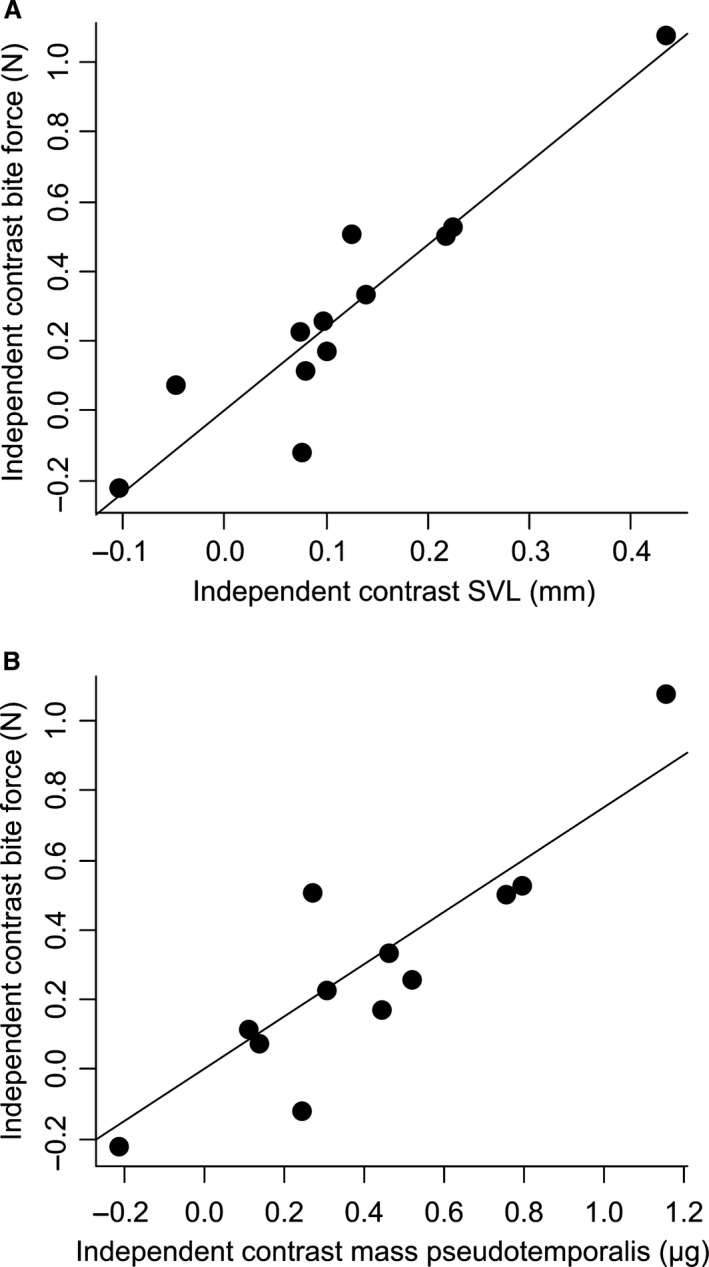
Figure 5.

Scatter plot of the independent contrasts of snout–vent length (A) and the independent contrasts of the mass of the pseudotemporalis muscle (B) against the independent contrasts of bite force for males. Note that the regression line passes through zero.
