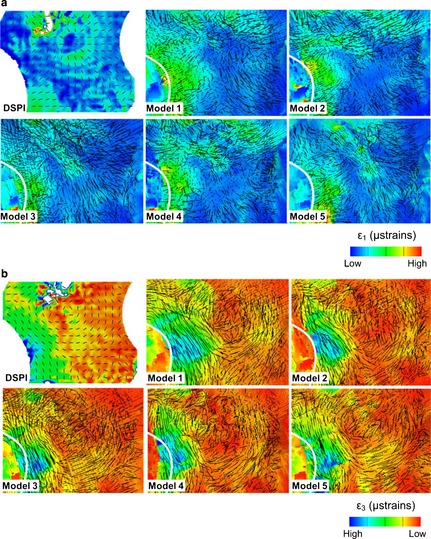
Figure 6.

In vitro vs. predicted directions of strains in the infraorbital region. Black lines represent the vectors of strains in 2D (DSPI) and 3D (FE models). (a) Maximum principal strain ε1 and (b) minimum principal strain ε3. To best match contours and to facilitate the identification of corresponding regions, vector magnitudes in the FEA outputs and ranges of each strain contour plot have been adjusted independently.
