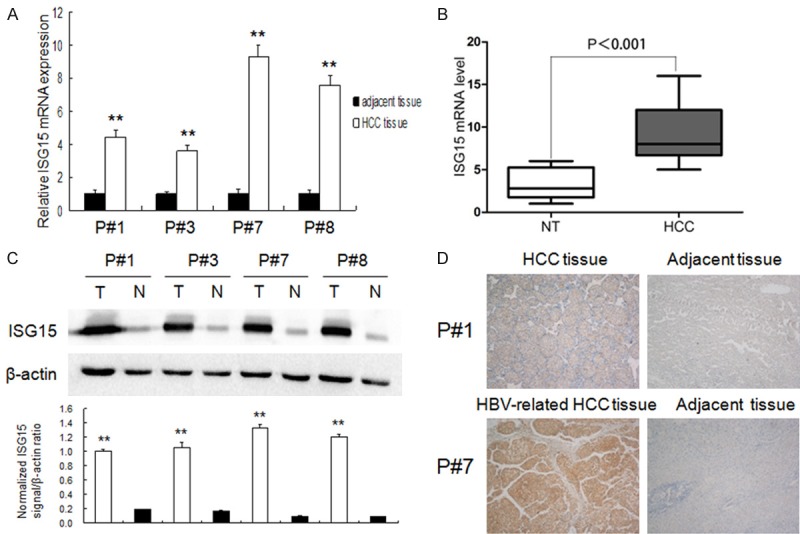
Figure 2.

ISG15 expression in HCC tissues. A, B: ISG15 mRNA expression HCC and corresponding adjacent no tumorous liver tissues using qRT-PCR (n = 199, P < 0.01); C: ISG15 protein expression in HCC tissues (T) and corresponding adjacent no tumorous liver tissues (N) using immunoblotting (upper). The protein level of ISG15 was quantified by densitometry in comparison with β-actin (bottom); D: The difference in Protein expression levels of ISG15 in HCC tissues was compared with the corresponding adjacent tissues by immunohistochemistry in patient specimens.
