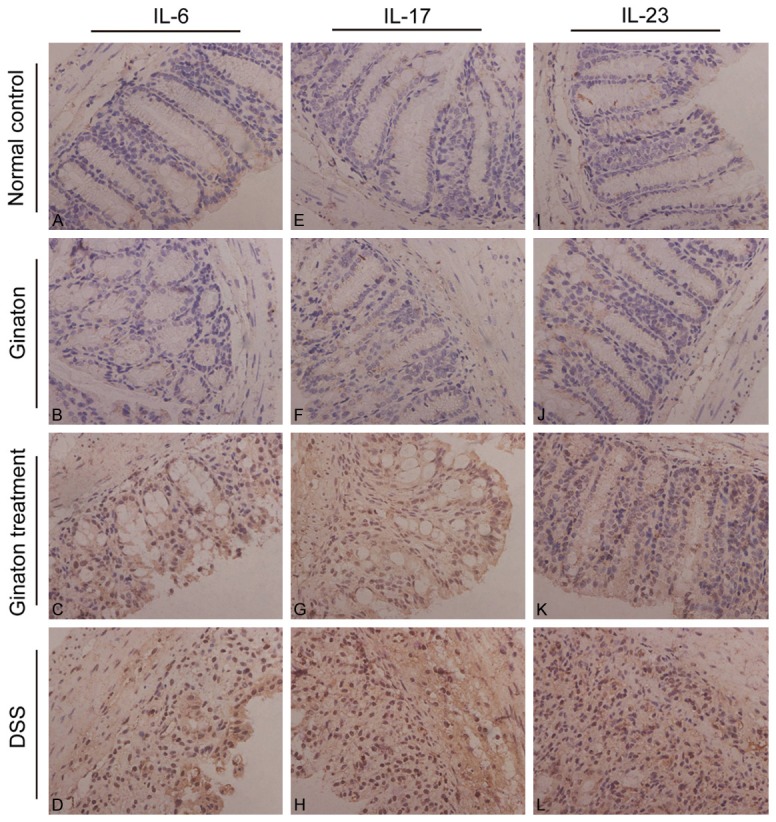
Figure 7.

Effect of Ginaton on expressions of IL-6 (A-D), IL-17 (E-H), and IL-23 (I-L) in normal control group (A, E, I), Ginaton group (B, F, J), Ginaton treatment group (C, G, K), and DSS group (D, H, L). IL-6, IL-17 and IL-23 were mainly distributed in the mucosa and submucosa layer of the colon. A large number of brown granules were seen in DSS group in contrast to normal control group. Compared with DSS group, less brown granules were found in Ginaton treatment group.
