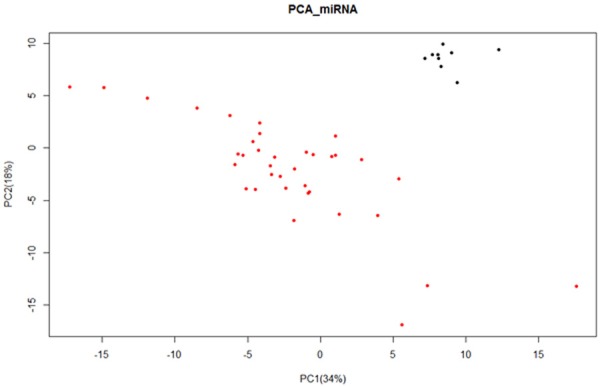
Figure 1.

Principal component analysis of the expression of miRNA. The abscissa axis represents that the first principal component occupies 34%, while the longitudinal axis represents that the second principal component occupies 18%. Red spots show specimens of bile duct cancer, while black spots show normal specimens.
